 Buy $GGs
Bitcoin (BTC) On-Chain Indicators Hit All Time Lows; What’s Next For BTC Price?


The Bitcoin (BTC) price consolidation over the past few weeks seems to be a never-ending wait for investors with volatility hitting rock bottom. As the BTC price continues to hover in the range of $29k to $30k, several on-chain indicators have reached a state of extreme apathy and exhaustion.
Let’s take a look at some of the on-chain indicators that hint at the lack of enough ammo for further upward price action.
Bitcoin Sees Modest Inflows
The Realized Cap stands out as a vital tool in on-chain analysis, reflecting the total capital influx since the beginning. The size and rate of change of the Realized Cap provide valuable insights, showing that over $16 billion (+4.1%) has entered Bitcoin this year.
Yet, the ascent appears gradual compared to the sharp surge witnessed in the 2021-22 upward trend. This suggests that although capital is entering, it’s happening at a relatively slow speed.

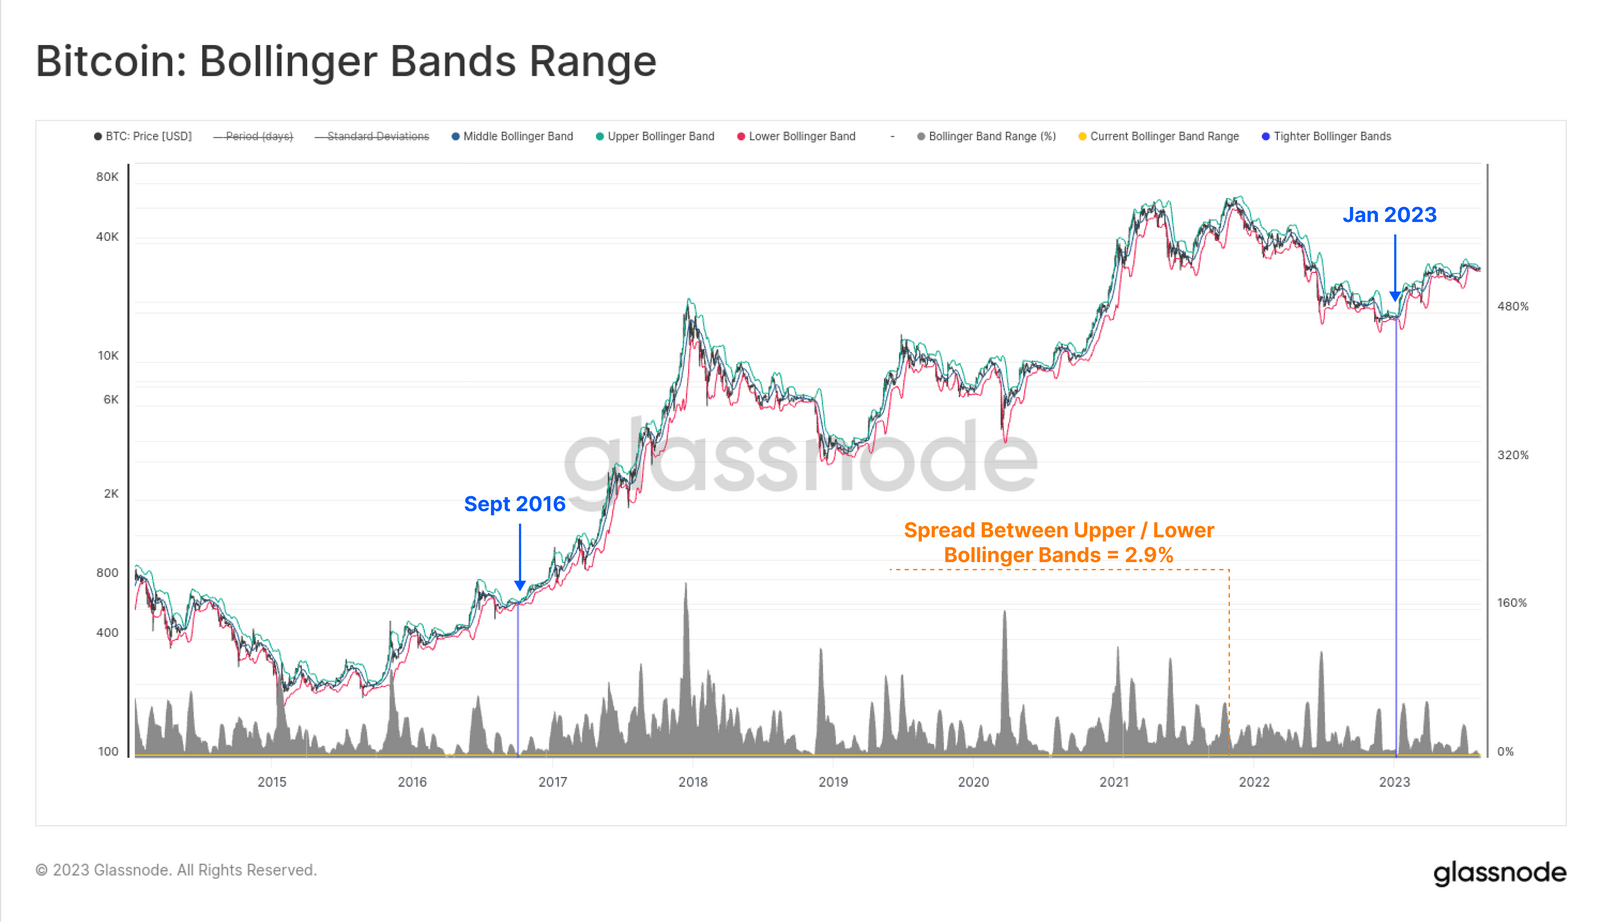
Bitcoin Volatility Compression
Bitcoin Bollinger Bands suggest that Bitcoin volatility has collapsed to historical lows. The upper and lower Bollinger Bands are separated just by 2.9%, thus, this low volatility compression was only seen on two occasions i.e. 2016 and Jan 2023.
Another way to understand the reduction in volatility (investor exhaustion) is by looking at how investors are spending their coins. Realized Value serves as a measure within this context:
- High Volatility: When there’s high volatility, investors tend to spend coins they acquired at prices much higher (resulting in losses) or much lower (resulting in profits) than the current spot exchange rate.
- Low Volatility and Exhaustion: In times of low volatility (when investors are exhausted), most of the coins being moved on-chain were likely acquired at prices very close to the current spot rate. This means that the realized profit or loss is minimal.
The Sell-Side Risk Ratio is a helpful tool to track this. It compares the absolute value of the realized profit or loss (the change in asset value) to the realized cap (the overall asset value). For short-term holders (STHs), this ratio is currently at an all-time low.
This suggests that nearly all the investors who intended to take profit or loss within this price range have already done so. As a result, the market might need a catalyst to encourage new spending, potentially indicating upcoming volatility, reports Glassnode.
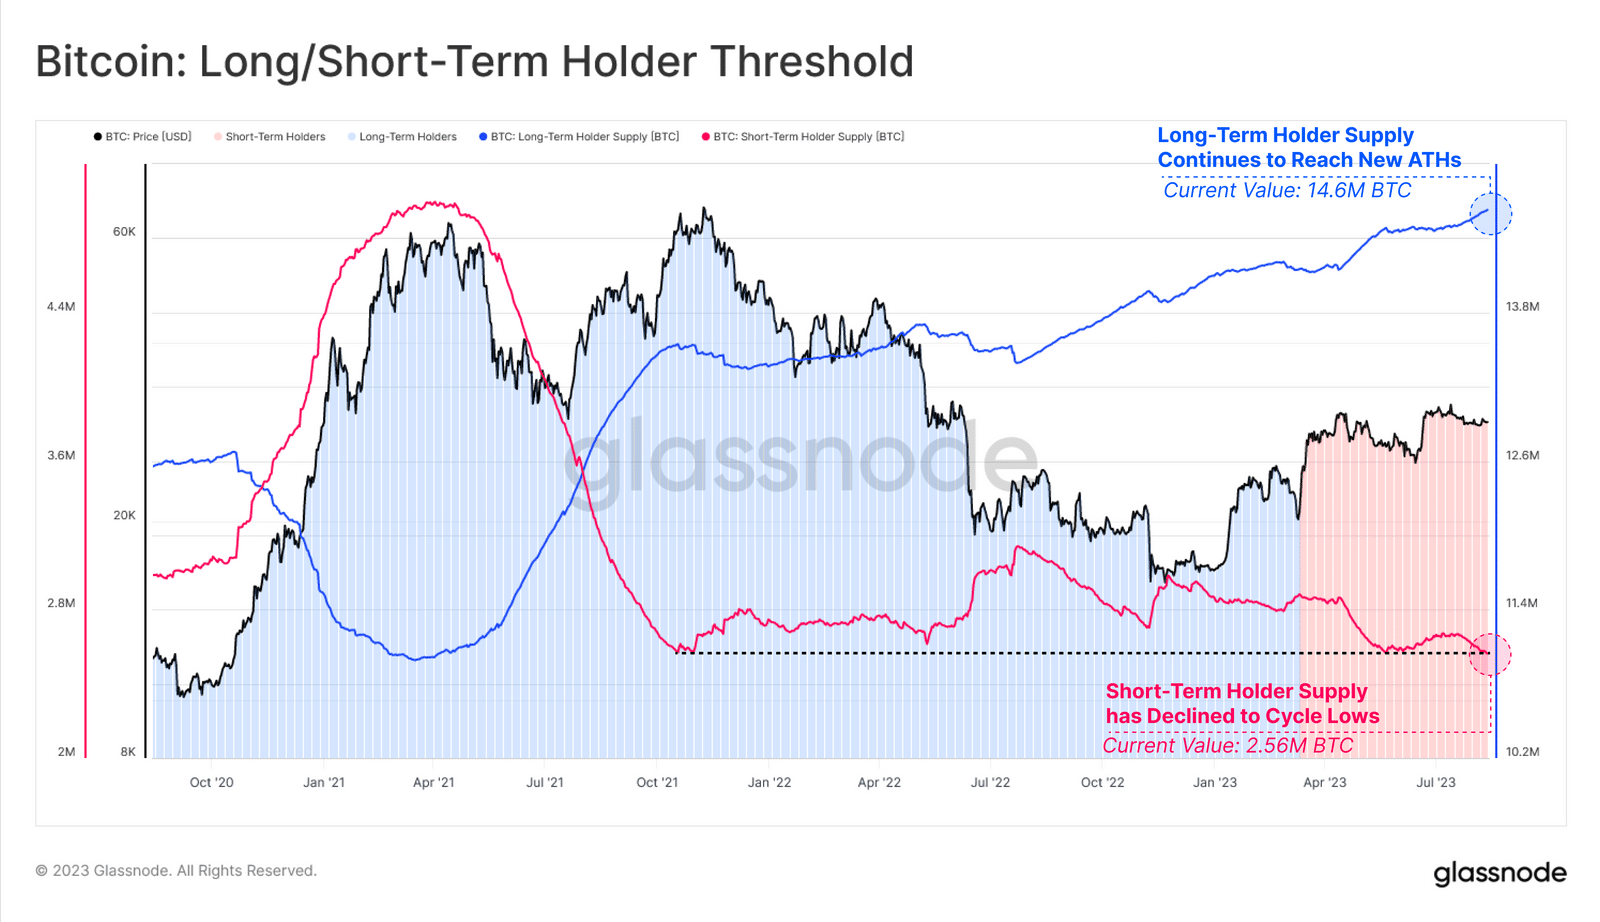
Bitcoin Long-Term Holder Supply
The amount of Bitcoin held by Long-Term Holders is continuously rising, reaching a record high of 14.6 million BTC. In contrast, the supply held by Short-Term Holders has dropped to a multi-year low of 2.56 million BTC.
In summary, this indicates that Bitcoin investors are maintaining strong conviction, as very few are opting to sell their holdings.
Play 10,000+ Casino Games at BC Game with Ease
- Instant Deposits And Withdrawals
- Crypto Casino And Sports Betting
- Exclusive Bonuses And Rewards


Why Trust CoinGape
CoinGape has covered the cryptocurrency industry since 2017, aiming to provide informative insights Read more… to our readers. Our journal analysts bring years of experience in market analysis and blockchain technology to ensure factual accuracy and balanced reporting. By following our Editorial Policy, our writers verify every source, fact-check each story, rely on reputable sources, and attribute quotes and media correctly. We also follow a rigorous Review Methodology when evaluating exchanges and tools. From emerging blockchain projects and coin launches to industry events and technical developments, we cover all facets of the digital asset space with unwavering commitment to timely, relevant information.

Delivered every day.
- Insights that move markets
- 100,000 active subscribers
Related Articles


- Bitcoin News: Anthony Pompliano’s ProCap Buys 450 BTC, Gold Bug Peter Schiff Reacts
- Fed Rate Cuts More Likely If U.S.-Iran Conflict Extends, Arthur Hayes Predicts
- Breaking: Ethereum Treasury BitMine Adds 50,928 ETH as Tom Lee Predicts March Bottom For Crypto Prices
- Bitget Champions Women’s Role in Crypto as Part of International Women’s Day Campaign
- Breaking: Michael Saylor’s Strategy Adds 3,015 BTC as Bitcoin Holds Steady Despite U.S.-Iran War
- Pi Coin Price Prediction for March 2026 Amid Network Upgrade, KYC Boost, Rewards Distribution
- Gold Price Nears ATH; Silver Eyes $100 Breakout on Us- Iran War
- Bitcoin And XRP Price As US Kills Iran Supreme Leader- Is A Crypto Crash Ahead?
- Gold Price Prediction 2026: Analysts Expect Gold to Reach $6,300 This Year
- Circle (CRCL) Stock Price Prediction as Today is the CLARITY Act Deadline
- Analysts Predict Where XRP Price Could Close This Week – March 2026


