Bitcoin Price Analysis: After Halving, What To Expect Now From BTC Price


So it finally happened! We hit block number 630,000 and with that, the Block Halving occurred. This means that miners are now receiving just 6.25 BTC per block, down from the previous 12.5 BTC per block that they were previously getting.
So the overarching question is; What Now?
Well, we can most certainly expect a whole lot of volatility over the next few days and weeks. Just because the block halving occurred, do not expect the price for the cryptocurrency to explode and head toward $20,000 instantly.
Instead, we are likely to see BTC heading down and then up in a whipsaw like fashion until a sustainable equilibrium is reached between miners’ costs and miners’ revenue.
Let me present the bullish and the bearish case for Bitcoin over these next few weeks.
Bitcoin Price Analysis
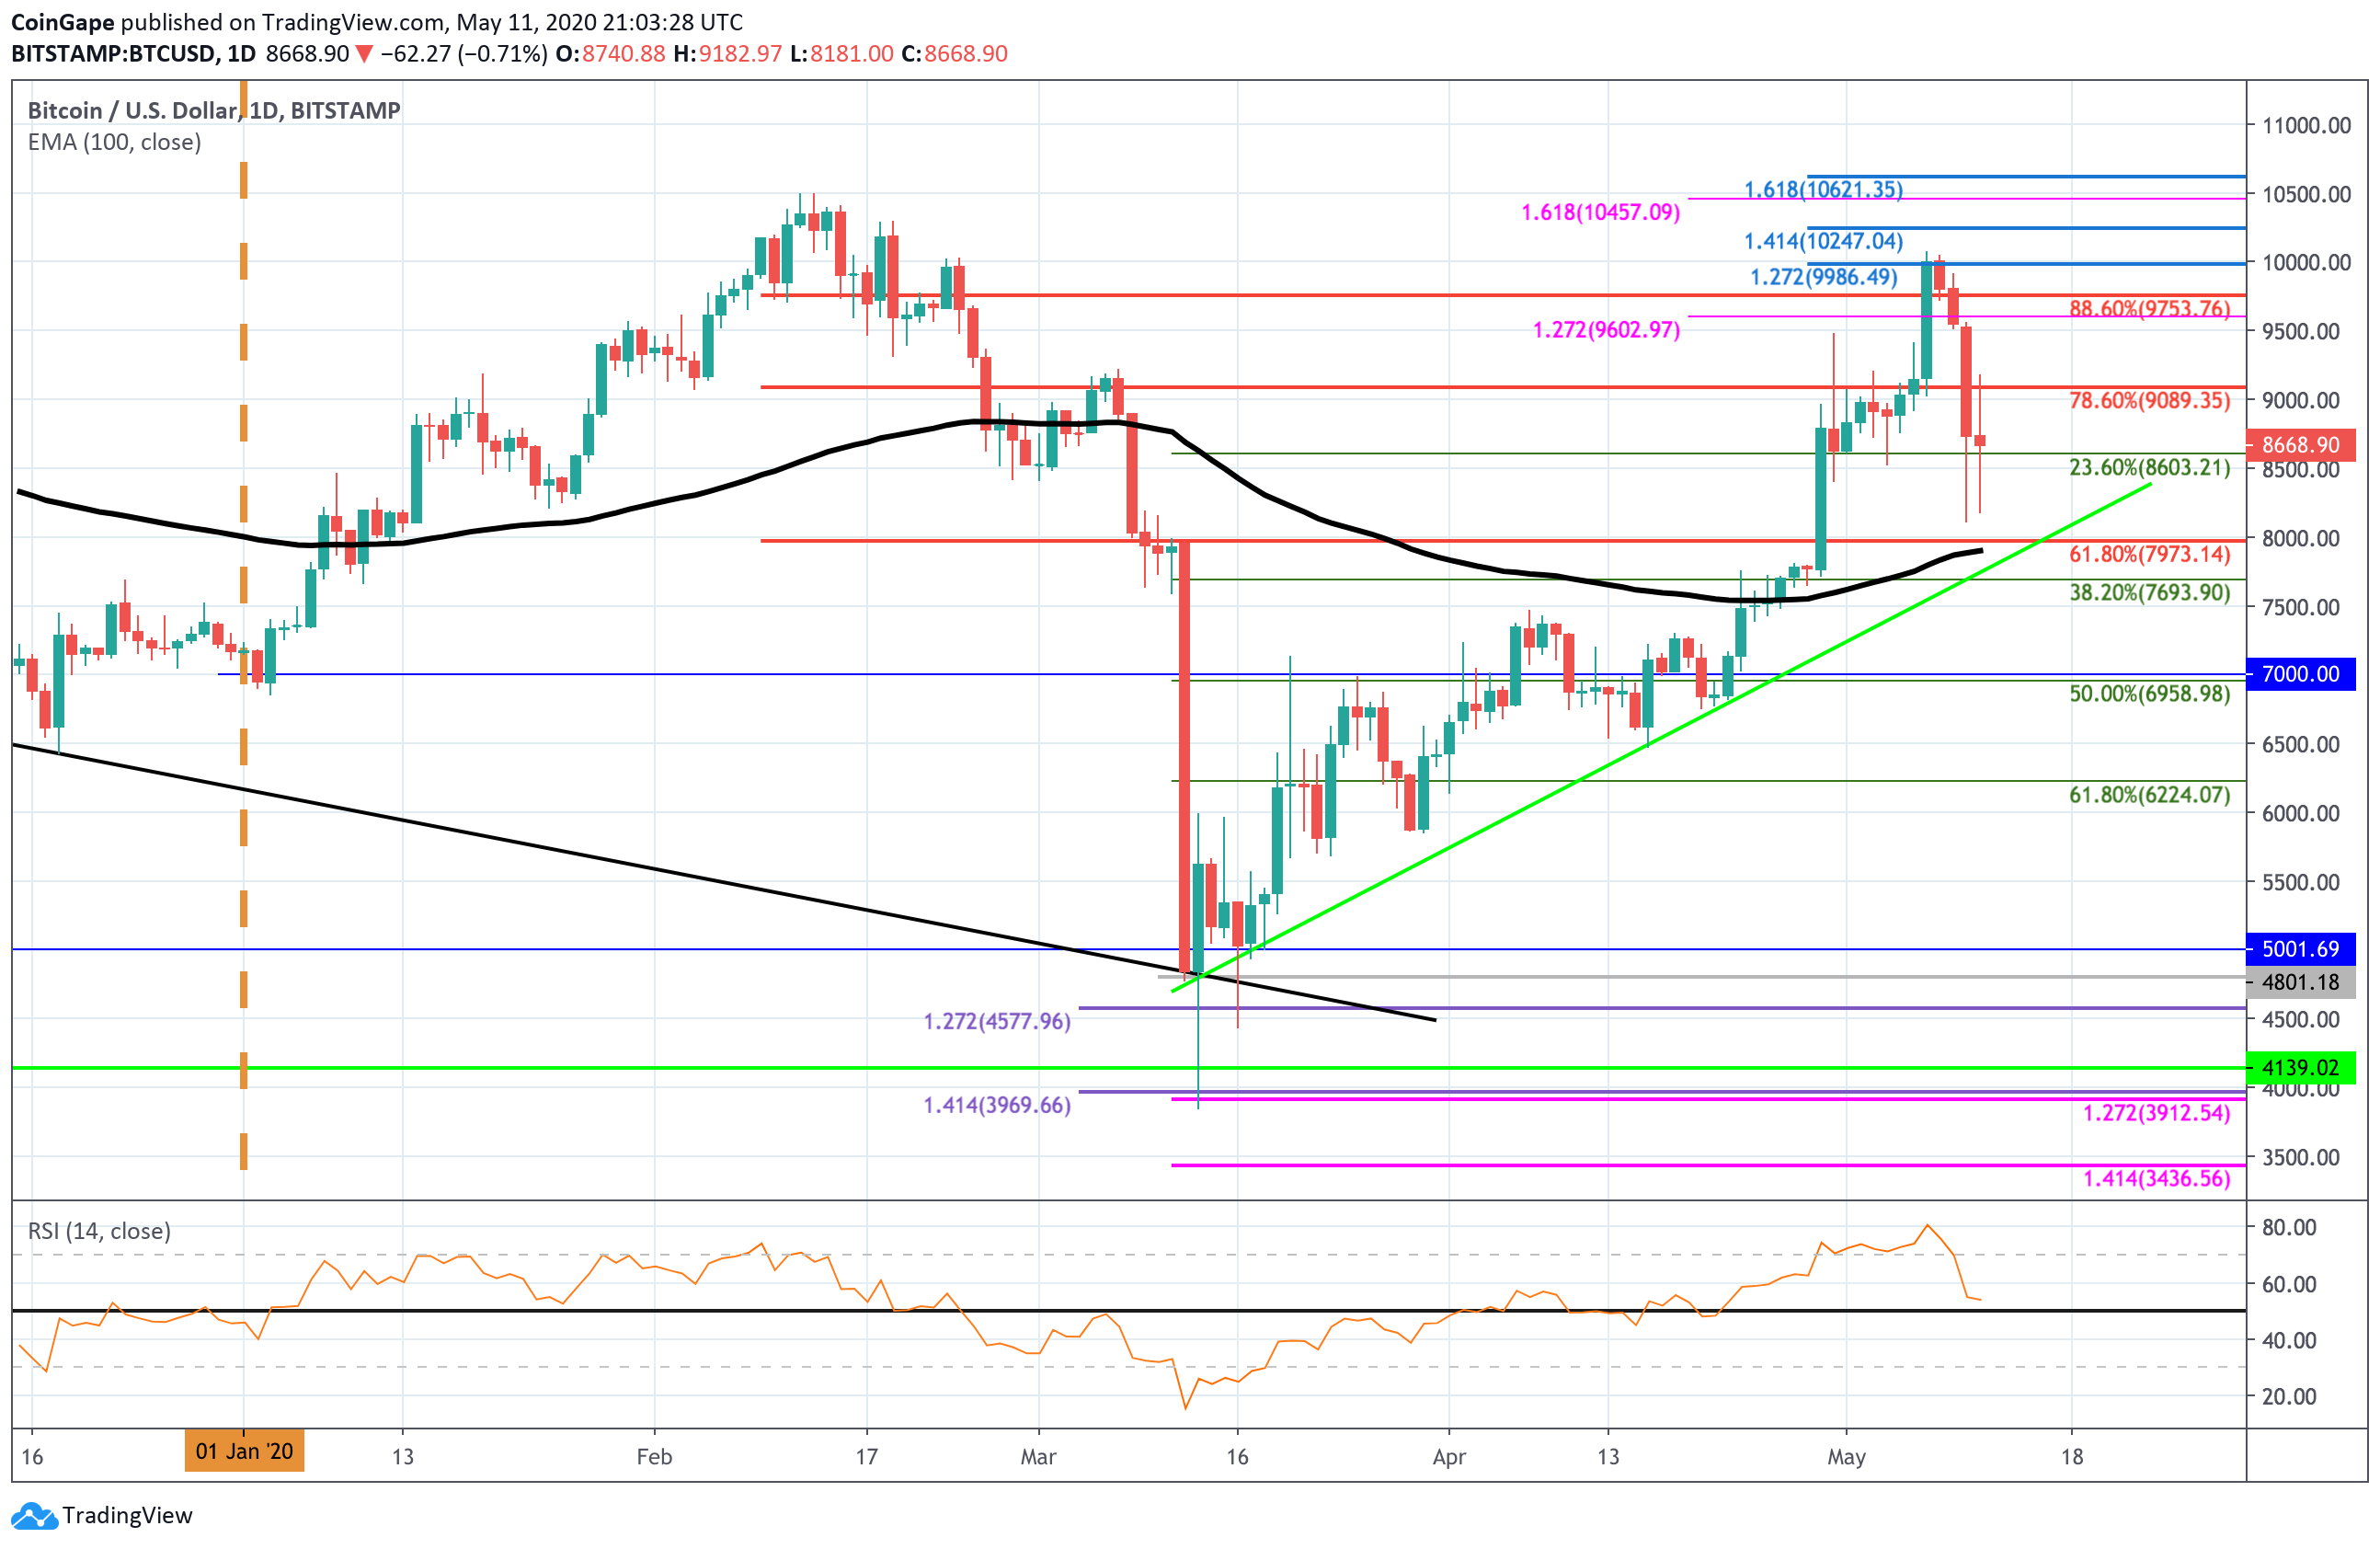
BTC/USD – Daily CHART – SHORT TERM
Market Overview
Taking a look at the daily chart above, we can see that not much has moved since the halving, we are still trading at the $8,600 range and remain supported by a short term .236 Fibonacci Retracement level. This $8,600 will be a critical level to keep your eyes on for the next 24 hours.
Bullish Case
So the bullish case would be that BTC rebounds from the current $8,600 support and starts to climb higher. In this case, the first level of strong resistance will be located at $9,090 (bearish .786 Fib Retracement). Above this, resistance lies at $9,300, $9,600, $9,750 (bearish .886 Fib Retracement), and $10,000.
Beyond $10,000 resistance is found at $10,247 and then 2020 high at around $10,457. If we can breach this resistance, BTC will certainly be headed toward the $15,000 level and possibly toward $20,000 by the end of the year.
Bearish Case
In the bearish case, we would first need to see BTC breaking the current support at $8,600. However, even if we break beneath this we still won’t be in a bearish trend. To turn fully bearish, the market would have to fall beneath $8,000 and break beneath the support at the 100-days EMA at $7,900 and penetrate beneath the green rising trend line.
If this occurs, we can expect support at $7,700 (.382 Fib Retracement), $7,500, $7,000 (.5 Fib Retracement), and $6,500.
Conclusion
Despite these two outlined cases, we are most likely to just whipsaw between $10,000 and $7,000 over the following weeks. A break beyond these two levels would dictate where we will be headed toward over the next few months.
Key Levels
Support: $8,600, $8,500, $8,200, $8,000, $7,690, $7,500.
Resistance: $9,000, $9,200, $9,600, $9,800, $10,000.

Why Trust CoinGape
CoinGape has covered the cryptocurrency industry since 2017, aiming to provide informative insights Read more… to our readers. Our journal analysts bring years of experience in market analysis and blockchain technology to ensure factual accuracy and balanced reporting. By following our Editorial Policy, our writers verify every source, fact-check each story, rely on reputable sources, and attribute quotes and media correctly. We also follow a rigorous Review Methodology when evaluating exchanges and tools. From emerging blockchain projects and coin launches to industry events and technical developments, we cover all facets of the digital asset space with unwavering commitment to timely, relevant information.

Delivered every day.
- Insights that move markets
- 100,000 active subscribers
Related Articles


- Trump’s Truth Social Files For Bitcoin, Ethereum, Cronos Crypto ETFs Amid Institutional Outflows
- Trump Tariffs: U.S. Supreme Court Sets February 20 for Potential Tariff Ruling
- Brazil Targets 1M BTC Strategic Reserve to Rival U.S. Bitcoin Stockpile
- Breaking: U.S. CPI Inflation Falls To 4-Year Low Of 2.4%, Bitcoin Rises
- Bitget Launches Gracy AI For Market Insights Amid Crypto Platforms Push For AI Integration
- Bitcoin Price Outlook As Gold And Silver Lose $3.6 Trillion in Market Value
- XRP and Ethereum Price Prediction as Trump Seeks to Lower Key Tariffs
- Solana Price Prediction as $2.6 Trillion Citi Expands Tokenized Products to SOL
- Bitcoin Price Could Fall to $50,000, Standard Chartered Says — Is a Crash Coming?
- Cardano Price Prediction Ahead of Midnight Mainnet Launch
- Pi Network Price Prediction as Mainnet Upgrade Deadline Nears on Feb 15


