Bitcoin Price Today Trades at $95K, US Moves Nearly $2B BTC

Highlights
- Bitcoin price today is down 1% and currently auctions around $95.5k.
- The US government moving nearly $2 billion BTC to Coinbase has increased the risk of prolonged downtrend.
- The $92k pivot level is key for a bounce, failure to hold here could catalyze a Bitcoin crash below $90k.
Bitcoin (BTC) price today trades at $95,976.0 on 11 PM. BTC price hit a daily high of $96,260.0 today after a 0.27% move on December 20.
Bitcoin Price Today: Will US Government Crash BTC?
As noted in previous CoinGape publication, US Government has moved $1.9 billion worth of BTC to Coinbase, likely to sell. This transfer has caused BTC to remain skittish. Bitcoin price today is down 0.27% and trades at $95,976.0. The recent downtrend hints that BTC has not yet found a stable support level to bounce from.
As BTC climbs down, the distance to $100k increases, highlighting the case of crypto volatility. Will Bitcoin price today recover or continue its descent?
*bitcoin price updated as of 11 PM.
Value of BTC trades at $95,976.0, bringing the year-to-date gain from 56% on October 20 to 120% as of December 20. The YTD performance has slumped due to the recent BTC crash. Although many altcoins have shot up over triple digits, Bitcoin is catching up. Ethereum price’s YTD performance is lackluster, stands at 45%, and is well below BTC.
Although Bitcoin is the largest cryptocurrency by market capitalization, Bitcoin’s popularity is due to its first-mover advantage and its being a secure, decentralized network. In addition, many narratives, like digital gold, inflation hedges, and uncorrelated assets, have kept BTC at the forefront of the crypto market since its inception in 2009.
Can Bitcoin End 2024 on Positive Note?
Industry veterans’ speculation of a bull run post-US elections was right, and Bitcoin is likely to end November 2024 on a positive note. Many even expect a six-digit target for BTC by the end of November, and this is due to the historical returns. History shows that Bitcoin has always performed massively in the fourth quarter.
With that said, if Bitcoin price hits a new ATH in November or December, Bitcoin’s market capitalization, which stands at $1,899.3 billion, could finally hit the $2 trillion mark.
Bitcoin’s Market Capitalization
While Bitcoin’s market cap hovers around $1,899.3 billion, with Ethereum, the duo controls nearly 65% of the total cryptocurrency market capitalization. Despite the seven-month consolidation, Bitcoin’s $1.93 trillion market cap remains strong, anticipating it reaching $2 trillion before 2025.
BTC: A composition of 24-hour Trading Volume
Being the top crypto has its benefits; more people tend to flock toward the asset. Likewise, BTC’s 24-hour trading volume stands at $90.0 billion. Binance, one of the largest cryptocurrency exchanges, contributes a major portion of this volume. Binance’s share of BTC’s 24-hour trading volume comprises spot and perpetuals trading. While spot volume hovers around 11%, perpetual volume is 41%. Exchanges like OKX, Bitget, etc, follow Binance.
Key Bitcoin Upgrades
With a market cap of $1.93 trillion, it is necessary for the network to remain secure, decentralized, and scalable. This is possible by upgrading the Bitcoin network regularly.
Here are some notable upgrades the Bitcoin network has received or planned to receive since its inception in 2009.
Bitcoin Network Upgrades Since 2009
Here are some key milestone upgrades to the Bitcoin network over the past decade.
2020-2024:
- Taproot Upgrade (2021): Improved Bitcoin’s smart contract functionality, allowing for more complex transactions and enhanced privacy.Muir Glacier Upgrade (2020): Delayed the “ice age” that would have slowed down the network, ensuring the continued smooth operation of Bitcoin.
2017-2019:
- Segregated Witness (SegWit) Upgrade (2017): Increased the block size limit, allowing for more transactions to be processed on the network, and improved the overall scalability of Bitcoin.
- Schnorr/Tapscript Upgrade (proposed): Aims to further improve the efficiency and scalability of Bitcoin transactions, but has not yet been activated.
- SegWit2x (canceled): A proposed upgrade that aimed to increase the block size limit, but was ultimately canceled due to lack of consensus.
2015-2016:
- Bitcoin Core 0.12.0 Upgrade (2016): Introduced several improvements, including better wallet management and enhanced security features.
- BIP66 Upgrade (2015): Standardized the way Bitcoin transactions are verified, improving the overall security and reliability of the network.
2013-2014:
- Bitcoin Core 0.9.0 Upgrade (2014): Introduced a new wallet format and improved the overall performance of the Bitcoin client.
- BIP0016 Upgrade (2013): Enabled the use of payment protocol, allowing for more efficient and secure transactions.
2010-2012:
- Pay-to-Script-Hash (P2SH) Upgrade (2012): Introduced a new type of transaction that allows for more complex payment scenarios, improving the overall flexibility of the Bitcoin network.
- Bitcoin Core 0.6.0 Upgrade (2011): Introduced several improvements, including better wallet management and enhanced security features.
2009-2010:
- Bitcoin Core 0.3.0 Upgrade (2009): One of the earliest upgrades to the Bitcoin network, introducing several key features and improvements.
Bitcoin Price Outlook For The Next Month
| Date | Price | Change |
|---|---|---|
| December 19, 2025 | 87378.01 | -0.51% |
| December 20, 2025 | 87412.93 | -0.47% |
| December 21, 2025 | 87447.86 | -0.43% |
| December 22, 2025 | 87482.78 | -0.39% |
| December 23, 2025 | 87517.71 | -0.35% |
| December 24, 2025 | 87552.63 | -0.31% |
| December 25, 2025 | 87587.55 | -0.27% |
| December 26, 2025 | 87622.48 | -0.23% |
| December 27, 2025 | 87657.40 | -0.19% |
| December 28, 2025 | 87692.33 | -0.15% |
| December 29, 2025 | 87727.25 | -0.11% |
| December 30, 2025 | 87762.18 | -0.07% |
| December 31, 2025 | 87797.10 | -0.03% |
| January 01, 2026 | 87832.02 | 0.01% |
| January 02, 2026 | 87880.79 | 0.06% |
| January 03, 2026 | 87929.56 | 0.12% |
| January 04, 2026 | 87978.33 | 0.17% |
| January 05, 2026 | 88027.09 | 0.23% |
| January 06, 2026 | 88075.86 | 0.28% |
| January 07, 2026 | 88124.63 | 0.34% |
| January 08, 2026 | 88173.40 | 0.39% |
| January 09, 2026 | 88222.16 | 0.45% |
| January 10, 2026 | 88270.93 | 0.5% |
| January 11, 2026 | 88319.70 | 0.56% |
| January 12, 2026 | 88368.47 | 0.62% |
| January 13, 2026 | 88417.23 | 0.67% |
| January 14, 2026 | 88466.00 | 0.73% |
| January 14, 2026 | 87581.34 | -0.28% |
| January 15, 2026 | 87167.40 | -0.75% |
| January 16, 2026 | 86994.55 | -0.95% |
Based on Coingape’s Bitcoin price prediction, investors can expect a double-digit rally that leads to a peak of $108,918 as of December 31. While there may be a brief correction, BTC’s trend remains bullish. Bitcoin Price Forecast Between 2025 and 2029
Bitcoin Price Outlook Between 2025 & 2029
| Month | Minimum Price | Average Price | Maximum Price | Potential ROI |
|---|---|---|---|---|
| January | $88,441.62 | $87,820.83 | $88,131.23 | 2.1% |
| February | $89,505.24 | $87,879.48 | $88,692.37 | 2.7% |
| March | $90,568.85 | $87,938.14 | $89,253.50 | 3.4% |
| April | $91,632.47 | $87,996.79 | $89,814.63 | 4% |
| May | $92,696.08 | $88,055.44 | $90,375.76 | 4.7% |
| June | $93,759.70 | $88,114.09 | $90,936.90 | 5.3% |
| July | $94,823.31 | $88,172.74 | $91,498.03 | 6% |
| August | $95,886.92 | $88,231.39 | $92,059.16 | 6.6% |
| September | $96,950.54 | $88,290.05 | $92,620.29 | 7.3% |
| October | $98,014.15 | $88,348.70 | $93,181.43 | 7.9% |
| November | $99,077.77 | $88,407.35 | $93,742.56 | 8.6% |
| December | $100,141.38 | $88,466 | $94,303.69 | 9.2% |
| All Time | $94,291.50 | $88,143.42 | $91,217.46 | 5.7% |
| Month | Minimum Price | Average Price | Maximum Price | Potential ROI |
|---|---|---|---|---|
| January | $107,480.85 | $97,337.42 | $104,737.22 | 21.3% |
| February | $114,820.32 | $106,208.83 | $115,170.74 | 33.4% |
| March | $122,159.79 | $115,080.25 | $125,604.27 | 45.5% |
| April | $129,499.25 | $123,951.67 | $136,037.79 | 57.6% |
| May | $136,838.72 | $132,823.08 | $146,471.32 | 69.7% |
| June | $144,178.19 | $141,694.50 | $156,904.85 | 81.7% |
| July | $151,517.66 | $150,565.92 | $167,338.37 | 93.8% |
| August | $158,857.13 | $159,437.33 | $177,771.90 | 105.9% |
| September | $166,196.60 | $168,308.75 | $188,205.42 | 118% |
| October | $173,536.06 | $177,180.17 | $198,638.95 | 130.1% |
| November | $180,875.53 | $186,051.58 | $209,072.47 | 142.2% |
| December | $188,215 | $194,923 | $219,506 | 154.3% |
| All Time | $147,847.92 | $146,130.21 | $162,121.61 | 87.8% |
| Month | Minimum Price | Average Price | Maximum Price | Potential ROI |
|---|---|---|---|---|
| January | $195,481 | $202,279.75 | $228,347.58 | 164.5% |
| February | $202,747 | $209,636.50 | $237,189.17 | 174.7% |
| March | $210,013 | $216,993.25 | $246,030.75 | 185% |
| April | $217,279 | $224,350 | $254,872.33 | 195.2% |
| May | $224,545 | $231,706.75 | $263,713.92 | 205.5% |
| June | $231,811 | $239,063.50 | $272,555.50 | 215.7% |
| July | $239,077 | $246,420.25 | $281,397.08 | 225.9% |
| August | $246,343 | $253,777 | $290,238.67 | 236.2% |
| September | $253,609 | $261,133.75 | $299,080.25 | 246.4% |
| October | $260,875 | $268,490.50 | $307,921.83 | 256.7% |
| November | $268,141 | $275,847.25 | $316,763.42 | 266.9% |
| December | $275,407 | $283,204 | $325,605 | 277.2% |
| All Time | $235,444 | $242,741.88 | $276,976.29 | 220.8% |
| Month | Minimum Price | Average Price | Maximum Price | Potential ROI |
|---|---|---|---|---|
| January | $285,565.25 | $293,892.50 | $338,177.42 | 291.7% |
| February | $295,723.50 | $304,581 | $350,749.83 | 306.3% |
| March | $305,881.75 | $315,269.50 | $363,322.25 | 320.8% |
| April | $316,040 | $325,958 | $375,894.67 | 335.4% |
| May | $326,198.25 | $336,646.50 | $388,467.08 | 350% |
| June | $336,356.50 | $347,335 | $401,039.50 | 364.5% |
| July | $346,514.75 | $358,023.50 | $413,611.92 | 379.1% |
| August | $356,673 | $368,712 | $426,184.33 | 393.7% |
| September | $366,831.25 | $379,400.50 | $438,756.75 | 408.2% |
| October | $376,989.50 | $390,089 | $451,329.17 | 422.8% |
| November | $387,147.75 | $400,777.50 | $463,901.58 | 437.3% |
| December | $397,306 | $411,466 | $476,474 | 451.9% |
| All Time | $341,435.63 | $352,679.25 | $407,325.71 | 371.8% |
| Month | Minimum Price | Average Price | Maximum Price | Potential ROI |
|---|---|---|---|---|
| January | $413,770.83 | $428,465.33 | $493,358.42 | 471.5% |
| February | $430,235.67 | $445,464.67 | $510,242.83 | 491% |
| March | $446,700.50 | $462,464 | $527,127.25 | 510.6% |
| April | $463,165.33 | $479,463.33 | $544,011.67 | 530.1% |
| May | $479,630.17 | $496,462.67 | $560,896.08 | 549.7% |
| June | $496,095 | $513,462 | $577,780.50 | 569.2% |
| July | $512,559.83 | $530,461.33 | $594,664.92 | 588.8% |
| August | $529,024.67 | $547,460.67 | $611,549.33 | 608.4% |
| September | $545,489.50 | $564,460 | $628,433.75 | 627.9% |
| October | $561,954.33 | $581,459.33 | $645,318.17 | 647.5% |
| November | $578,419.17 | $598,458.67 | $662,202.58 | 667% |
| December | $594,884 | $615,458 | $679,087 | 686.6% |
| All Time | $504,327.42 | $521,961.67 | $586,222.71 | 579% |
In the next year, aka 2025, Bitcoin price is likely to stay well above the six-digit territory and shows no signs of correction below it. Coingape’s Bitcoin price prediction data reveals a peak of $104,280.26 in February 2025.
Bitcoin Price Outlook Between 2030 and 2050
| Month | Minimum Price | Average Price | Maximum Price | Potential ROI |
|---|---|---|---|---|
| January | $617,065.67 | $637,976.67 | $709,750.17 | 722.1% |
| February | $639,247.33 | $660,495.33 | $740,413.33 | 757.6% |
| March | $661,429 | $683,014 | $771,076.50 | 793.1% |
| April | $683,610.67 | $705,532.67 | $801,739.67 | 828.7% |
| May | $705,792.33 | $728,051.33 | $832,402.83 | 864.2% |
| June | $727,974 | $750,570 | $863,066 | 899.7% |
| July | $750,155.67 | $773,088.67 | $893,729.17 | 935.2% |
| August | $772,337.33 | $795,607.33 | $924,392.33 | 970.7% |
| September | $794,519 | $818,126 | $955,055.50 | 1006.2% |
| October | $816,700.67 | $840,644.67 | $985,718.67 | 1041.8% |
| November | $838,882.33 | $863,163.33 | $1,016,381.83 | 1077.3% |
| December | $861,064 | $885,682 | $1,047,045 | 1112.8% |
| All Time | $739,064.83 | $761,829.33 | $878,397.58 | 917.5% |
| Month | Minimum Price | Average Price | Maximum Price | Potential ROI |
|---|---|---|---|---|
| January | $893,600.33 | $919,119.08 | $1,083,647 | 1155.2% |
| February | $926,136.67 | $952,556.17 | $1,120,249 | 1197.6% |
| March | $958,673 | $985,993.25 | $1,156,851 | 1240% |
| April | $991,209.33 | $1,019,430.33 | $1,193,453 | 1282.4% |
| May | $1,023,745.67 | $1,052,867.42 | $1,230,055 | 1324.8% |
| June | $1,056,282 | $1,086,304.50 | $1,266,657 | 1367.2% |
| July | $1,088,818.33 | $1,119,741.58 | $1,303,259 | 1409.6% |
| August | $1,121,354.67 | $1,153,178.67 | $1,339,861 | 1452% |
| September | $1,153,891 | $1,186,615.75 | $1,376,463 | 1494.4% |
| October | $1,186,427.33 | $1,220,052.83 | $1,413,065 | 1536.8% |
| November | $1,218,963.67 | $1,253,489.92 | $1,449,667 | 1579.2% |
| December | $1,251,500 | $1,286,927 | $1,486,269 | 1621.6% |
| All Time | $1,072,550.17 | $1,103,023.04 | $1,284,958 | 1388.4% |
| Month | Minimum Price | Average Price | Maximum Price | Potential ROI |
|---|---|---|---|---|
| January | $1,300,715.75 | $1,338,552.75 | $1,545,122.92 | 1689.7% |
| February | $1,349,931.50 | $1,390,178.50 | $1,603,976.83 | 1757.9% |
| March | $1,399,147.25 | $1,441,804.25 | $1,662,830.75 | 1826.1% |
| April | $1,448,363 | $1,493,430 | $1,721,684.67 | 1894.2% |
| May | $1,497,578.75 | $1,545,055.75 | $1,780,538.58 | 1962.4% |
| June | $1,546,794.50 | $1,596,681.50 | $1,839,392.50 | 2030.6% |
| July | $1,596,010.25 | $1,648,307.25 | $1,898,246.42 | 2098.7% |
| August | $1,645,226 | $1,699,933 | $1,957,100.33 | 2166.9% |
| September | $1,694,441.75 | $1,751,558.75 | $2,015,954.25 | 2235.1% |
| October | $1,743,657.50 | $1,803,184.50 | $2,074,808.17 | 2303.3% |
| November | $1,792,873.25 | $1,854,810.25 | $2,133,662.08 | 2371.4% |
| December | $1,842,089 | $1,906,436 | $2,192,516 | 2439.6% |
| All Time | $1,571,402.38 | $1,622,494.38 | $1,868,819.46 | 2064.7% |
| Month | Minimum Price | Average Price | Maximum Price | Potential ROI |
|---|---|---|---|---|
| January | $1,908,609.25 | $1,973,948.75 | $2,276,708.17 | 2537.1% |
| February | $1,975,129.50 | $2,041,461.50 | $2,360,900.33 | 2634.6% |
| March | $2,041,649.75 | $2,108,974.25 | $2,445,092.50 | 2732.2% |
| April | $2,108,170 | $2,176,487 | $2,529,284.67 | 2829.7% |
| May | $2,174,690.25 | $2,243,999.75 | $2,613,476.83 | 2927.2% |
| June | $2,241,210.50 | $2,311,512.50 | $2,697,669 | 3024.7% |
| July | $2,307,730.75 | $2,379,025.25 | $2,781,861.17 | 3122.2% |
| August | $2,374,251 | $2,446,538 | $2,866,053.33 | 3219.8% |
| September | $2,440,771.25 | $2,514,050.75 | $2,950,245.50 | 3317.3% |
| October | $2,507,291.50 | $2,581,563.50 | $3,034,437.67 | 3414.8% |
| November | $2,573,811.75 | $2,649,076.25 | $3,118,629.83 | 3512.3% |
| December | $2,640,332 | $2,716,589 | $3,202,822 | 3609.8% |
| All Time | $2,274,470.63 | $2,345,268.88 | $2,739,765.08 | 3073.5% |
| Month | Minimum Price | Average Price | Maximum Price | Potential ROI |
|---|---|---|---|---|
| January | $2,728,184.50 | $2,811,669.67 | $3,268,702.33 | 3686.2% |
| February | $2,816,037 | $2,906,750.33 | $3,334,582.67 | 3762.5% |
| March | $2,903,889.50 | $3,001,831 | $3,400,463 | 3838.8% |
| April | $2,991,742 | $3,096,911.67 | $3,466,343.33 | 3915.1% |
| May | $3,079,594.50 | $3,191,992.33 | $3,532,223.67 | 3991.4% |
| June | $3,167,447 | $3,287,073 | $3,598,104 | 4067.7% |
| July | $3,255,299.50 | $3,382,153.67 | $3,663,984.33 | 4144% |
| August | $3,343,152 | $3,477,234.33 | $3,729,864.67 | 4220.3% |
| September | $3,431,004.50 | $3,572,315 | $3,795,745 | 4296.6% |
| October | $3,518,857 | $3,667,395.67 | $3,861,625.33 | 4372.9% |
| November | $3,606,709.50 | $3,762,476.33 | $3,927,505.67 | 4449.3% |
| December | $3,694,562 | $3,857,557 | $3,993,386 | 4525.6% |
| All Time | $3,211,373.25 | $3,334,613.33 | $3,631,044.17 | 4105.9% |
| Month | Minimum Price | Average Price | Maximum Price | Potential ROI |
|---|---|---|---|---|
| January | $3,794,170.25 | $3,957,165.25 | $4,111,104.92 | 4661.9% |
| February | $3,893,778.50 | $4,056,773.50 | $4,228,823.83 | 4798.3% |
| March | $3,993,386.75 | $4,156,381.75 | $4,346,542.75 | 4934.6% |
| April | $4,092,995 | $4,255,990 | $4,464,261.67 | 5071% |
| May | $4,192,603.25 | $4,355,598.25 | $4,581,980.58 | 5207.3% |
| June | $4,292,211.50 | $4,455,206.50 | $4,699,699.50 | 5343.7% |
| July | $4,391,819.75 | $4,554,814.75 | $4,817,418.42 | 5480% |
| August | $4,491,428 | $4,654,423 | $4,935,137.33 | 5616.4% |
| September | $4,591,036.25 | $4,754,031.25 | $5,052,856.25 | 5752.8% |
| October | $4,690,644.50 | $4,853,639.50 | $5,170,575.17 | 5889.1% |
| November | $4,790,252.75 | $4,953,247.75 | $5,288,294.08 | 6025.5% |
| December | $4,889,861 | $5,052,856 | $5,406,013 | 6161.8% |
| All Time | $4,342,015.63 | $4,505,010.63 | $4,758,558.96 | 5411.9% |
Roughly five years from now, aka 2030, Bitcoin’s price will see an explosion to the upside, with an all-time high of $774,474 in the aforementioned year. In the same period, BTC could reach a low of $465,154.42. Based on CoinGape predictions, the average price of BTC in 2050 is between $2.9 million and $3.3 million.
Investors should note that these long-term predictions can change and, hence, should be taken with a grain of salt.
Bitcoin Price Analysis: Will BTC Drop
Bitcoin’s momentum seems to have been cut off after November 10, leading to a slow consolidation. Since November 11, BTC has set up an all-time high (ATH) at $99,690 but has failed to establish a clear directional bias. From its ATH, the largest crypto by market cap has shed 8.88% and now trades at $95,976.0. Will Bitcoin price end its consolidation and resume its uptrend or continue to slide lower and break the short-term uptrend?
The Relative Strength Index (RSI) has been on a downtrend since it hit the overbought zone on November 21 and has not yet tagged the oversold level yet. During an uptrend, when price starts to consolidate, it will most likely hit an oversold level before it resume the bullish outlook. On the one-hour chart, RSI is still below the 50 mean level and is likely to continue its descent.
Furthremore, the US government moving $1.9 billion BTC to Coinbase Exchange also does not help the bulls’ case.
So, if BTC continues its descent, there are a few levels where it could pivot and trigger a rally. The first such level is Monday’s low at $94,455. If a sweep of this level is followed by a show of strength with swing lows holding or producing higher lows, it would signal that a further drop is unlikely.
The second pivot point at $92,625 is a recently flipped support level. This barrier served as a strong resistance for almost a week between November 13 and 19. A breakout from which propelled BTC to an ATH of $99,690. Hence, a failure to hold around the Monday’s low will see $99,625, the second pivot level come into picture.
From a four-hour to one-day time frame, $87,367 is a key swing low and a breakdown of which will invalidate the short-term uptrend that began in early November. Hence, investors must be cautious when price appraoches this level.
As mentioned above, any of these three high probability reversal levels could restart Bitcoin’s uptrend and lead to a retest of the $100,000 psychological level.
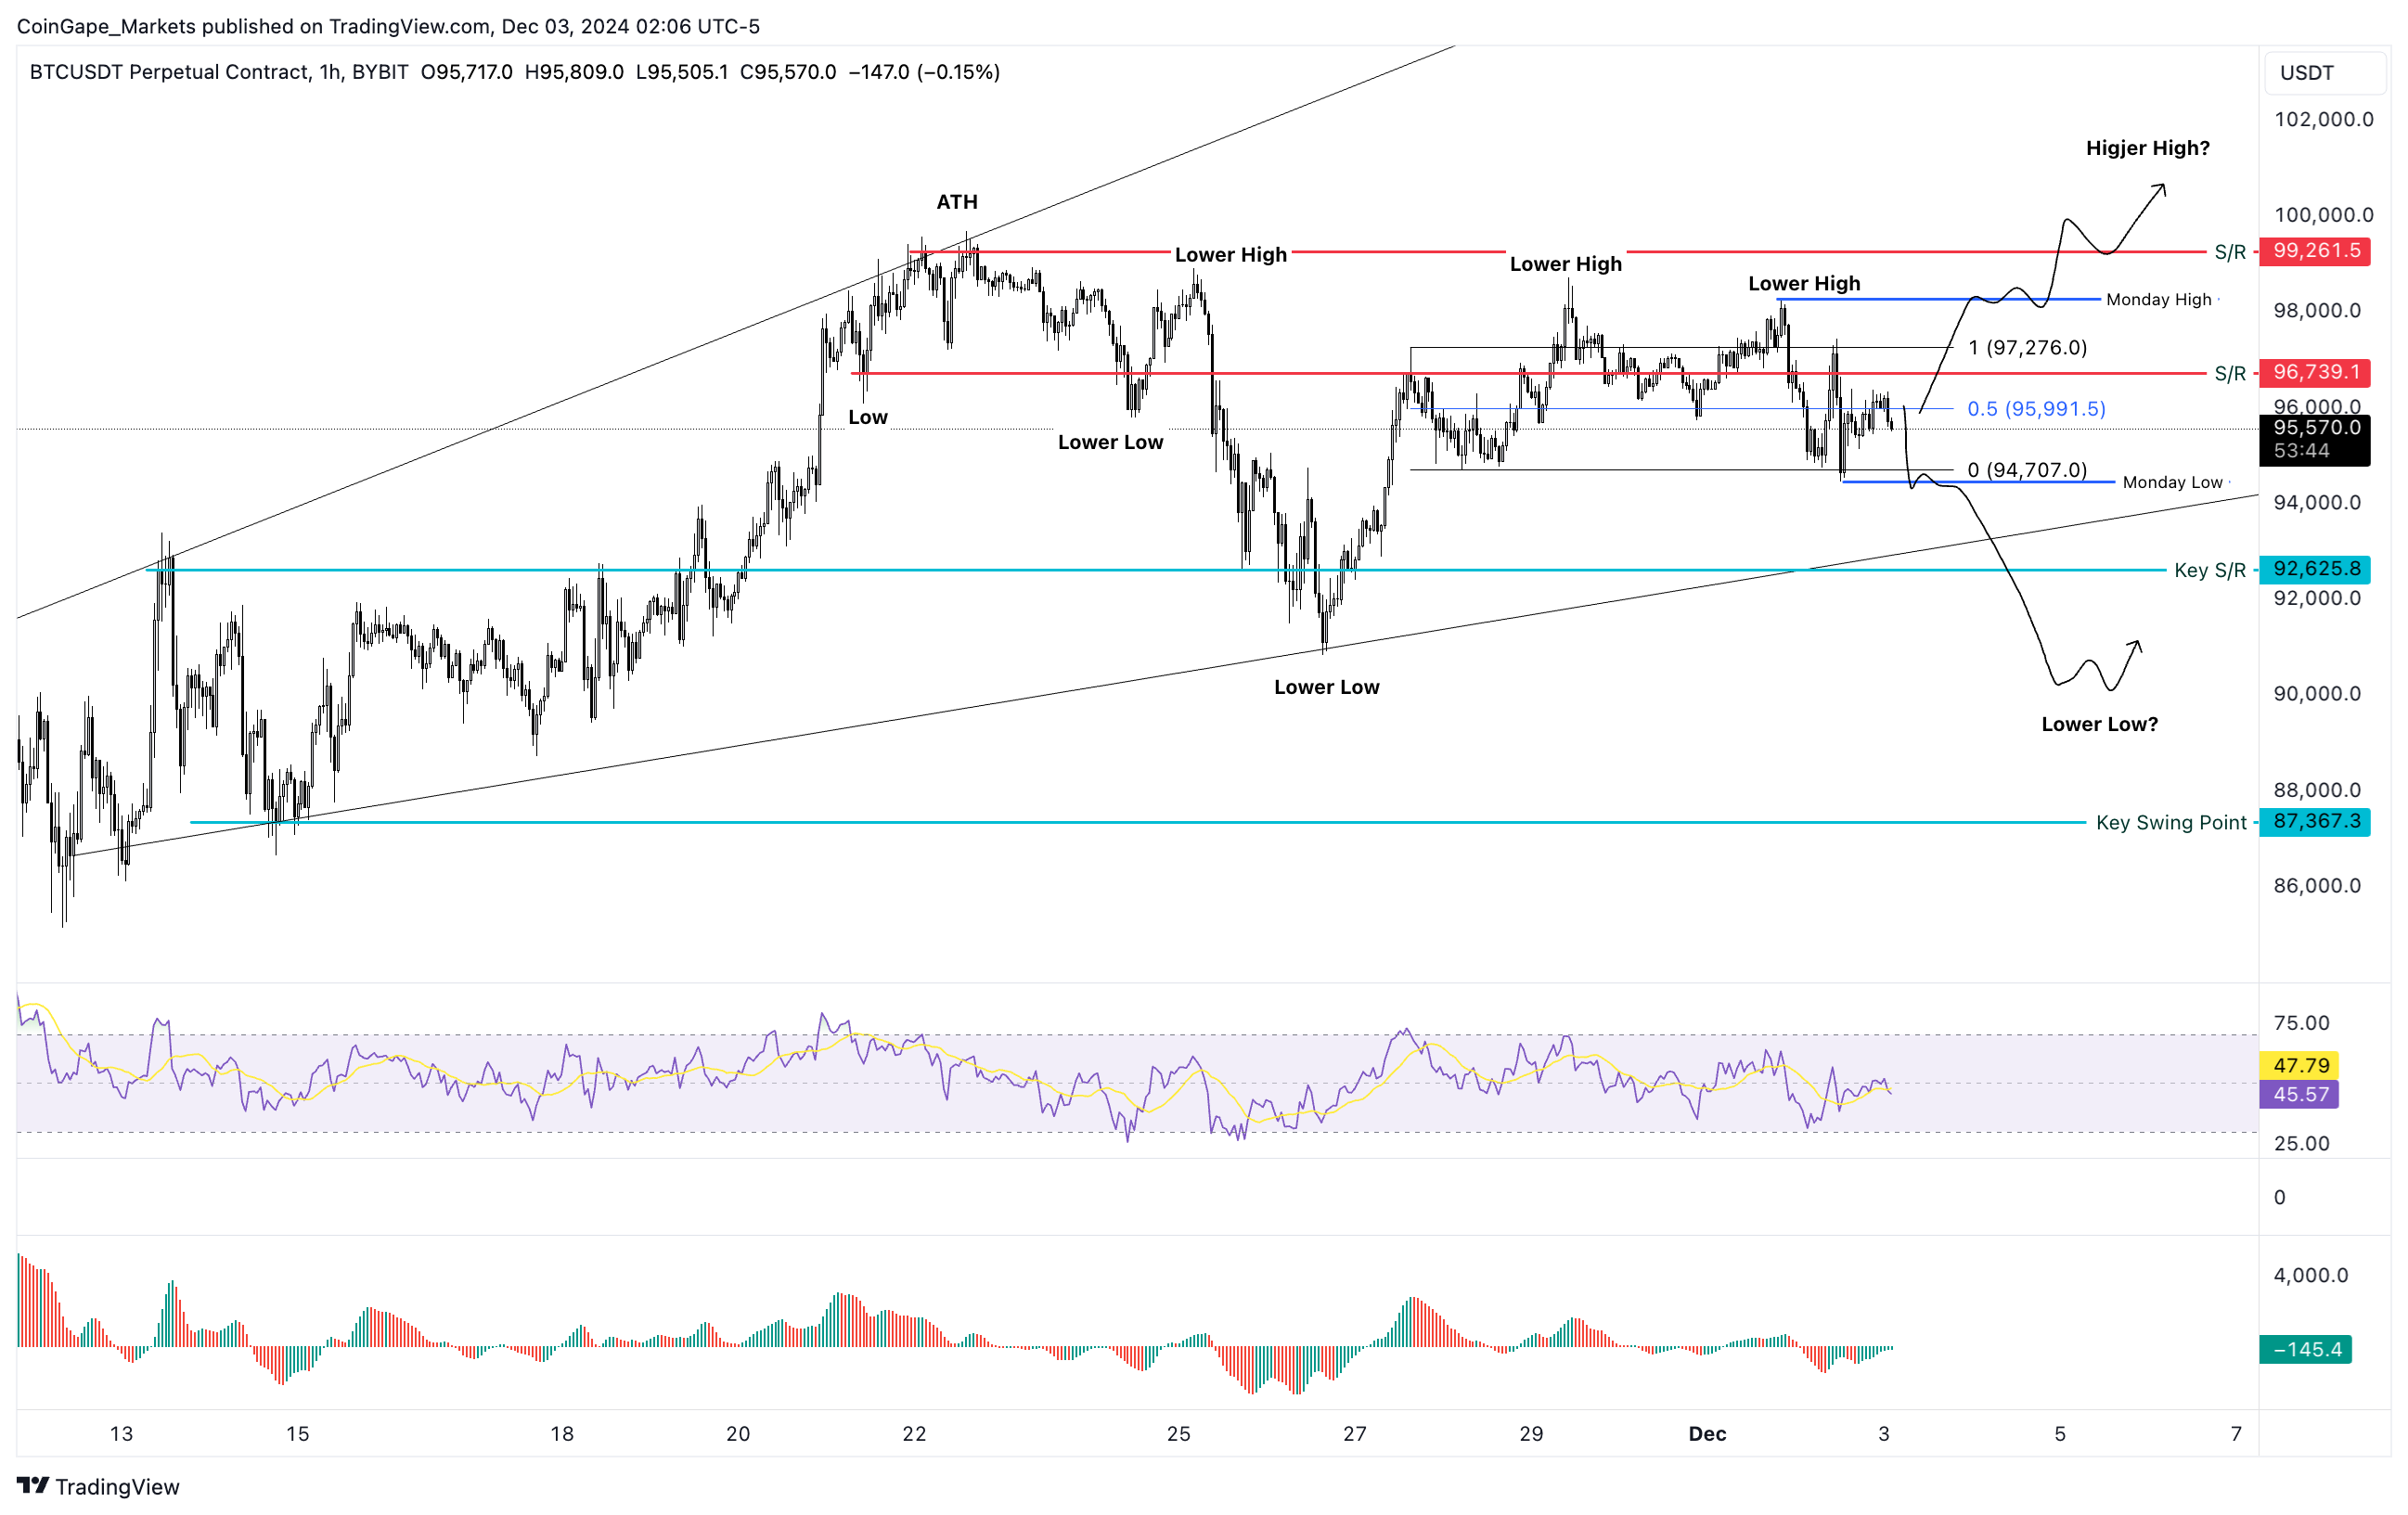
On the other hand, if Bitcoin breaks the $90,000 psychological level, it will invalidate the bullish thesis. A decisive daily candlestick close below $87,367 will confirm this outlook and could trigger a 12% correction to next key support at $77,074.
Recent Posts
- Crypto News
BlackRock Bitcoin ETF Ranks Among Top ETFs In 2025 Despite Crypto Downturn
The BlackRock Bitcoin ETF (IBIT) has emerged as one of the top exchange-traded funds (ETF)…
- Crypto News
Stablecoin Adoption Deepens as Klarna Turns to Coinbase for Institutional Liquidity
Klarna has taken a major step into crypto finance by partnering with Coinbase to accept…
- Crypto News
Ripple, Circle Could Gain Fed Access as Board Seeks Feedback on ‘Skinny Master Account’
The U.S. Federal Reserve has requested public feedback on the payment accounts, also known as…
- Crypto News
Fed’s Williams Says No Urgency to Cut Rates Further as Crypto Traders Bet Against January Cut
New York Federal Reserve President John Williams has signaled his support for holding rates steady…
- Crypto News
Trump to Interview BlackRock’s Rick Rieder as Fed Chair Shortlist Narrows to Four
The Fed chair race is heating up with U.S. President Donald Trump set to interview…
- Crypto News
Breaking: VanEck Discloses Fees and Staking Details for its Avalanche ETF
The leading crypto asset manager VanEck amends its Avalanche ETF with the U.S. Securities and…