Bitcoin Price Today: What’s Next After $100K BTC

Highlights
- Bitcoin price today is up nearly 6% leading to a $100K retest.
- The early Asian session rally pushed BTC to setup a new ATH of $104,698.
- A reentry into the $98.7K to $90.8K range would invalidate the bullish thesis.
With Bitcoin (BTC) price today hovering around $96,773.0 on 11 PM, the talks of alt season or altcoin season has picked up steam. BTC price hit a daily high of $103,679.0 today after a -2.23% move on December 19.
Bitcoin Price Today: What Comes After New All-time High?
Although the US transferring nearly $2 billion BTC dampened the mood, Bitcoin price held its own and trigger a massive impulsive move that set up a new all-time high (ATH) of $104,698 in the late America session on Wednesday. Bitcoin price today is up -2.23% and trades at $96,773.0.
*bitcoin price updated as of 11 PM.
Value of BTC trades at $96,773.0, bringing the year-to-date gain from 56% on October 20 to 120% as of December 19. The YTD performance has slumped due to the recent BTC crash. Although many altcoins have shot up over triple digits, Bitcoin is catching up. Ethereum price’s YTD performance is lackluster, stands at 45%, and is well below BTC.
Although Bitcoin is the largest cryptocurrency by market capitalization, Bitcoin’s popularity is due to its first-mover advantage and its being a secure, decentralized network. In addition, many narratives, like digital gold, inflation hedges, and uncorrelated assets, have kept BTC at the forefront of the crypto market since its inception in 2009.
Bitcoin to End 2024 on Positive Note
Industry veterans’ speculation of a bull run post-US elections was right, and Bitcoin is likely to end November 2024 on a positive note. Many even expect a six-digit target for BTC by the end of November, and this is due to the historical returns. History shows that Bitcoin has always performed massively in the fourth quarter.
With that said, if Bitcoin price hits a new ATH in November or December, Bitcoin’s market capitalization, which stands at $1,916.9 billion, could finally hit the $2 trillion mark.
Bitcoin’s Market Capitalization
While Bitcoin’s market cap hovers around $1,916.9 billion, with Ethereum, the duo controls nearly 65% of the total cryptocurrency market capitalization. Despite the seven-month consolidation, Bitcoin’s $1.93 trillion market cap remains strong, anticipating it reaching $2 trillion before 2025.
BTC: A composition of 24-hour Trading Volume
Being the top crypto has its benefits; more people tend to flock toward the asset. Likewise, BTC’s 24-hour trading volume stands at $196.6 billion. Binance, one of the largest cryptocurrency exchanges, contributes a major portion of this volume. Binance’s share of BTC’s 24-hour trading volume comprises spot and perpetuals trading. While spot volume hovers around 11%, perpetual volume is 41%. Exchanges like OKX, Bitget, etc, follow Binance.
Key Bitcoin Upgrades
With a market cap of $1.93 trillion, it is necessary for the network to remain secure, decentralized, and scalable. This is possible by upgrading the Bitcoin network regularly.
Here are some notable upgrades the Bitcoin network has received or planned to receive since its inception in 2009.
Bitcoin Network Upgrades Since 2009
Here are some key milestone upgrades to the Bitcoin network over the past decade.
2020-2024:
- Taproot Upgrade (2021): Improved Bitcoin’s smart contract functionality, allowing for more complex transactions and enhanced privacy.Muir Glacier Upgrade (2020): Delayed the “ice age” that would have slowed down the network, ensuring the continued smooth operation of Bitcoin.
2017-2019:
- Segregated Witness (SegWit) Upgrade (2017): Increased the block size limit, allowing for more transactions to be processed on the network, and improved the overall scalability of Bitcoin.
- Schnorr/Tapscript Upgrade (proposed): Aims to further improve the efficiency and scalability of Bitcoin transactions, but has not yet been activated.
- SegWit2x (canceled): A proposed upgrade that aimed to increase the block size limit, but was ultimately canceled due to lack of consensus.
2015-2016:
- Bitcoin Core 0.12.0 Upgrade (2016): Introduced several improvements, including better wallet management and enhanced security features.
- BIP66 Upgrade (2015): Standardized the way Bitcoin transactions are verified, improving the overall security and reliability of the network.
2013-2014:
- Bitcoin Core 0.9.0 Upgrade (2014): Introduced a new wallet format and improved the overall performance of the Bitcoin client.
- BIP0016 Upgrade (2013): Enabled the use of payment protocol, allowing for more efficient and secure transactions.
2010-2012:
- Pay-to-Script-Hash (P2SH) Upgrade (2012): Introduced a new type of transaction that allows for more complex payment scenarios, improving the overall flexibility of the Bitcoin network.
- Bitcoin Core 0.6.0 Upgrade (2011): Introduced several improvements, including better wallet management and enhanced security features.
2009-2010:
- Bitcoin Core 0.3.0 Upgrade (2009): One of the earliest upgrades to the Bitcoin network, introducing several key features and improvements.
Bitcoin Price Outlook For Next 30 Days
| Date | Price | Change |
|---|---|---|
| December 18, 2025 | 86785.87 | -0.31% |
| December 19, 2025 | 86837.81 | -0.25% |
| December 20, 2025 | 86889.74 | -0.19% |
| December 21, 2025 | 86941.68 | -0.13% |
| December 22, 2025 | 86993.61 | -0.07% |
| December 23, 2025 | 87045.55 | -0.01% |
| December 24, 2025 | 87097.48 | 0.04% |
| December 25, 2025 | 87149.41 | 0.1% |
| December 26, 2025 | 87201.35 | 0.16% |
| December 27, 2025 | 87253.28 | 0.22% |
| December 28, 2025 | 87305.22 | 0.28% |
| December 29, 2025 | 87357.15 | 0.34% |
| December 30, 2025 | 87409.08 | 0.4% |
| December 31, 2025 | 87461.02 | 0.46% |
| January 01, 2026 | 87523.25 | 0.53% |
| January 02, 2026 | 87595.77 | 0.62% |
| January 03, 2026 | 87668.28 | 0.7% |
| January 04, 2026 | 87740.80 | 0.78% |
| January 05, 2026 | 87813.32 | 0.87% |
| January 06, 2026 | 87885.84 | 0.95% |
| January 07, 2026 | 87958.36 | 1.03% |
| January 08, 2026 | 88030.88 | 1.12% |
| January 09, 2026 | 88103.40 | 1.2% |
| January 10, 2026 | 88175.92 | 1.28% |
| January 11, 2026 | 88248.44 | 1.37% |
| January 12, 2026 | 88320.96 | 1.45% |
| January 13, 2026 | 88393.48 | 1.53% |
| January 14, 2026 | 88466.00 | 1.62% |
| January 14, 2026 | 87581.34 | 0.6% |
| January 15, 2026 | 87167.40 | 0.13% |
Based on Coingape’s Bitcoin price prediction, investors can expect a double-digit rally that leads to a peak of $108,918 as of December 31. While there may be a brief correction, BTC’s trend remains bullish. Bitcoin Price Forecast Between 2025 and 2029
Bitcoin Price Outlook Between 2025 & 2029
| Month | Minimum Price | Average Price | Maximum Price | Potential ROI |
|---|---|---|---|---|
| January | $87,889.46 | $87,497.16 | $87,693.31 | 1.6% |
| February | $88,993.06 | $87,585.23 | $88,289.15 | 2.3% |
| March | $90,096.65 | $87,673.31 | $88,884.98 | 3% |
| April | $91,200.24 | $87,761.39 | $89,480.82 | 3.6% |
| May | $92,303.83 | $87,849.46 | $90,076.65 | 4.3% |
| June | $93,407.43 | $87,937.54 | $90,672.49 | 5% |
| July | $94,511.02 | $88,025.62 | $91,268.32 | 5.7% |
| August | $95,614.61 | $88,113.69 | $91,864.15 | 6.4% |
| September | $96,718.20 | $88,201.77 | $92,459.99 | 7.1% |
| October | $97,821.80 | $88,289.85 | $93,055.82 | 7.8% |
| November | $98,925.39 | $88,377.92 | $93,651.66 | 8.5% |
| December | $100,028.98 | $88,466 | $94,247.49 | 9.2% |
| All Time | $93,959.22 | $87,981.58 | $90,970.40 | 5.4% |
| Month | Minimum Price | Average Price | Maximum Price | Potential ROI |
|---|---|---|---|---|
| January | $107,377.82 | $97,337.42 | $104,685.70 | 21.3% |
| February | $114,726.65 | $106,208.83 | $115,123.91 | 33.3% |
| March | $122,075.49 | $115,080.25 | $125,562.12 | 45.4% |
| April | $129,424.32 | $123,951.67 | $136,000.33 | 57.5% |
| May | $136,773.16 | $132,823.08 | $146,438.54 | 69.6% |
| June | $144,121.99 | $141,694.50 | $156,876.75 | 81.7% |
| July | $151,470.83 | $150,565.92 | $167,314.95 | 93.8% |
| August | $158,819.66 | $159,437.33 | $177,753.16 | 105.9% |
| September | $166,168.50 | $168,308.75 | $188,191.37 | 118% |
| October | $173,517.33 | $177,180.17 | $198,629.58 | 130.1% |
| November | $180,866.17 | $186,051.58 | $209,067.79 | 142.2% |
| December | $188,215 | $194,923 | $219,506 | 154.3% |
| All Time | $147,796.41 | $146,130.21 | $162,095.85 | 87.8% |
| Month | Minimum Price | Average Price | Maximum Price | Potential ROI |
|---|---|---|---|---|
| January | $195,481 | $202,279.75 | $228,347.58 | 164.5% |
| February | $202,747 | $209,636.50 | $237,189.17 | 174.7% |
| March | $210,013 | $216,993.25 | $246,030.75 | 185% |
| April | $217,279 | $224,350 | $254,872.33 | 195.2% |
| May | $224,545 | $231,706.75 | $263,713.92 | 205.5% |
| June | $231,811 | $239,063.50 | $272,555.50 | 215.7% |
| July | $239,077 | $246,420.25 | $281,397.08 | 225.9% |
| August | $246,343 | $253,777 | $290,238.67 | 236.2% |
| September | $253,609 | $261,133.75 | $299,080.25 | 246.4% |
| October | $260,875 | $268,490.50 | $307,921.83 | 256.7% |
| November | $268,141 | $275,847.25 | $316,763.42 | 266.9% |
| December | $275,407 | $283,204 | $325,605 | 277.2% |
| All Time | $235,444 | $242,741.88 | $276,976.29 | 220.8% |
| Month | Minimum Price | Average Price | Maximum Price | Potential ROI |
|---|---|---|---|---|
| January | $285,565.25 | $293,892.50 | $338,177.42 | 291.7% |
| February | $295,723.50 | $304,581 | $350,749.83 | 306.3% |
| March | $305,881.75 | $315,269.50 | $363,322.25 | 320.8% |
| April | $316,040 | $325,958 | $375,894.67 | 335.4% |
| May | $326,198.25 | $336,646.50 | $388,467.08 | 350% |
| June | $336,356.50 | $347,335 | $401,039.50 | 364.5% |
| July | $346,514.75 | $358,023.50 | $413,611.92 | 379.1% |
| August | $356,673 | $368,712 | $426,184.33 | 393.7% |
| September | $366,831.25 | $379,400.50 | $438,756.75 | 408.2% |
| October | $376,989.50 | $390,089 | $451,329.17 | 422.8% |
| November | $387,147.75 | $400,777.50 | $463,901.58 | 437.3% |
| December | $397,306 | $411,466 | $476,474 | 451.9% |
| All Time | $341,435.63 | $352,679.25 | $407,325.71 | 371.8% |
| Month | Minimum Price | Average Price | Maximum Price | Potential ROI |
|---|---|---|---|---|
| January | $413,770.83 | $428,465.33 | $493,358.42 | 471.5% |
| February | $430,235.67 | $445,464.67 | $510,242.83 | 491% |
| March | $446,700.50 | $462,464 | $527,127.25 | 510.6% |
| April | $463,165.33 | $479,463.33 | $544,011.67 | 530.1% |
| May | $479,630.17 | $496,462.67 | $560,896.08 | 549.7% |
| June | $496,095 | $513,462 | $577,780.50 | 569.2% |
| July | $512,559.83 | $530,461.33 | $594,664.92 | 588.8% |
| August | $529,024.67 | $547,460.67 | $611,549.33 | 608.4% |
| September | $545,489.50 | $564,460 | $628,433.75 | 627.9% |
| October | $561,954.33 | $581,459.33 | $645,318.17 | 647.5% |
| November | $578,419.17 | $598,458.67 | $662,202.58 | 667% |
| December | $594,884 | $615,458 | $679,087 | 686.6% |
| All Time | $504,327.42 | $521,961.67 | $586,222.71 | 579% |
In the next year, aka 2025, Bitcoin price is likely to stay well above the six-digit territory and shows no signs of correction below it. Coingape’s Bitcoin price prediction data reveals a peak of $104,280.26 in February 2025.
Bitcoin Price Outlook Between 2030 and 2050
| Month | Minimum Price | Average Price | Maximum Price | Potential ROI |
|---|---|---|---|---|
| January | $617,065.67 | $637,976.67 | $709,750.17 | 722.1% |
| February | $639,247.33 | $660,495.33 | $740,413.33 | 757.6% |
| March | $661,429 | $683,014 | $771,076.50 | 793.1% |
| April | $683,610.67 | $705,532.67 | $801,739.67 | 828.7% |
| May | $705,792.33 | $728,051.33 | $832,402.83 | 864.2% |
| June | $727,974 | $750,570 | $863,066 | 899.7% |
| July | $750,155.67 | $773,088.67 | $893,729.17 | 935.2% |
| August | $772,337.33 | $795,607.33 | $924,392.33 | 970.7% |
| September | $794,519 | $818,126 | $955,055.50 | 1006.2% |
| October | $816,700.67 | $840,644.67 | $985,718.67 | 1041.8% |
| November | $838,882.33 | $863,163.33 | $1,016,381.83 | 1077.3% |
| December | $861,064 | $885,682 | $1,047,045 | 1112.8% |
| All Time | $739,064.83 | $761,829.33 | $878,397.58 | 917.5% |
| Month | Minimum Price | Average Price | Maximum Price | Potential ROI |
|---|---|---|---|---|
| January | $893,600.33 | $919,119.08 | $1,083,647 | 1155.2% |
| February | $926,136.67 | $952,556.17 | $1,120,249 | 1197.6% |
| March | $958,673 | $985,993.25 | $1,156,851 | 1240% |
| April | $991,209.33 | $1,019,430.33 | $1,193,453 | 1282.4% |
| May | $1,023,745.67 | $1,052,867.42 | $1,230,055 | 1324.8% |
| June | $1,056,282 | $1,086,304.50 | $1,266,657 | 1367.2% |
| July | $1,088,818.33 | $1,119,741.58 | $1,303,259 | 1409.6% |
| August | $1,121,354.67 | $1,153,178.67 | $1,339,861 | 1452% |
| September | $1,153,891 | $1,186,615.75 | $1,376,463 | 1494.4% |
| October | $1,186,427.33 | $1,220,052.83 | $1,413,065 | 1536.8% |
| November | $1,218,963.67 | $1,253,489.92 | $1,449,667 | 1579.2% |
| December | $1,251,500 | $1,286,927 | $1,486,269 | 1621.6% |
| All Time | $1,072,550.17 | $1,103,023.04 | $1,284,958 | 1388.4% |
| Month | Minimum Price | Average Price | Maximum Price | Potential ROI |
|---|---|---|---|---|
| January | $1,300,715.75 | $1,338,552.75 | $1,545,122.92 | 1689.7% |
| February | $1,349,931.50 | $1,390,178.50 | $1,603,976.83 | 1757.9% |
| March | $1,399,147.25 | $1,441,804.25 | $1,662,830.75 | 1826.1% |
| April | $1,448,363 | $1,493,430 | $1,721,684.67 | 1894.2% |
| May | $1,497,578.75 | $1,545,055.75 | $1,780,538.58 | 1962.4% |
| June | $1,546,794.50 | $1,596,681.50 | $1,839,392.50 | 2030.6% |
| July | $1,596,010.25 | $1,648,307.25 | $1,898,246.42 | 2098.7% |
| August | $1,645,226 | $1,699,933 | $1,957,100.33 | 2166.9% |
| September | $1,694,441.75 | $1,751,558.75 | $2,015,954.25 | 2235.1% |
| October | $1,743,657.50 | $1,803,184.50 | $2,074,808.17 | 2303.3% |
| November | $1,792,873.25 | $1,854,810.25 | $2,133,662.08 | 2371.4% |
| December | $1,842,089 | $1,906,436 | $2,192,516 | 2439.6% |
| All Time | $1,571,402.38 | $1,622,494.38 | $1,868,819.46 | 2064.7% |
| Month | Minimum Price | Average Price | Maximum Price | Potential ROI |
|---|---|---|---|---|
| January | $1,908,609.25 | $1,973,948.75 | $2,276,708.17 | 2537.1% |
| February | $1,975,129.50 | $2,041,461.50 | $2,360,900.33 | 2634.6% |
| March | $2,041,649.75 | $2,108,974.25 | $2,445,092.50 | 2732.2% |
| April | $2,108,170 | $2,176,487 | $2,529,284.67 | 2829.7% |
| May | $2,174,690.25 | $2,243,999.75 | $2,613,476.83 | 2927.2% |
| June | $2,241,210.50 | $2,311,512.50 | $2,697,669 | 3024.7% |
| July | $2,307,730.75 | $2,379,025.25 | $2,781,861.17 | 3122.2% |
| August | $2,374,251 | $2,446,538 | $2,866,053.33 | 3219.8% |
| September | $2,440,771.25 | $2,514,050.75 | $2,950,245.50 | 3317.3% |
| October | $2,507,291.50 | $2,581,563.50 | $3,034,437.67 | 3414.8% |
| November | $2,573,811.75 | $2,649,076.25 | $3,118,629.83 | 3512.3% |
| December | $2,640,332 | $2,716,589 | $3,202,822 | 3609.8% |
| All Time | $2,274,470.63 | $2,345,268.88 | $2,739,765.08 | 3073.5% |
| Month | Minimum Price | Average Price | Maximum Price | Potential ROI |
|---|---|---|---|---|
| January | $2,728,184.50 | $2,811,669.67 | $3,268,702.33 | 3686.2% |
| February | $2,816,037 | $2,906,750.33 | $3,334,582.67 | 3762.5% |
| March | $2,903,889.50 | $3,001,831 | $3,400,463 | 3838.8% |
| April | $2,991,742 | $3,096,911.67 | $3,466,343.33 | 3915.1% |
| May | $3,079,594.50 | $3,191,992.33 | $3,532,223.67 | 3991.4% |
| June | $3,167,447 | $3,287,073 | $3,598,104 | 4067.7% |
| July | $3,255,299.50 | $3,382,153.67 | $3,663,984.33 | 4144% |
| August | $3,343,152 | $3,477,234.33 | $3,729,864.67 | 4220.3% |
| September | $3,431,004.50 | $3,572,315 | $3,795,745 | 4296.6% |
| October | $3,518,857 | $3,667,395.67 | $3,861,625.33 | 4372.9% |
| November | $3,606,709.50 | $3,762,476.33 | $3,927,505.67 | 4449.3% |
| December | $3,694,562 | $3,857,557 | $3,993,386 | 4525.6% |
| All Time | $3,211,373.25 | $3,334,613.33 | $3,631,044.17 | 4105.9% |
| Month | Minimum Price | Average Price | Maximum Price | Potential ROI |
|---|---|---|---|---|
| January | $3,794,170.25 | $3,957,165.25 | $4,111,104.92 | 4661.9% |
| February | $3,893,778.50 | $4,056,773.50 | $4,228,823.83 | 4798.3% |
| March | $3,993,386.75 | $4,156,381.75 | $4,346,542.75 | 4934.6% |
| April | $4,092,995 | $4,255,990 | $4,464,261.67 | 5071% |
| May | $4,192,603.25 | $4,355,598.25 | $4,581,980.58 | 5207.3% |
| June | $4,292,211.50 | $4,455,206.50 | $4,699,699.50 | 5343.7% |
| July | $4,391,819.75 | $4,554,814.75 | $4,817,418.42 | 5480% |
| August | $4,491,428 | $4,654,423 | $4,935,137.33 | 5616.4% |
| September | $4,591,036.25 | $4,754,031.25 | $5,052,856.25 | 5752.8% |
| October | $4,690,644.50 | $4,853,639.50 | $5,170,575.17 | 5889.1% |
| November | $4,790,252.75 | $4,953,247.75 | $5,288,294.08 | 6025.5% |
| December | $4,889,861 | $5,052,856 | $5,406,013 | 6161.8% |
| All Time | $4,342,015.63 | $4,505,010.63 | $4,758,558.96 | 5411.9% |
Roughly five years from now, aka 2030, Bitcoin’s price will see an explosion to the upside, with an all-time high of $774,474 in the aforementioned year. In the same period, BTC could reach a low of $465,154.42. Based on CoinGape predictions, the average price of BTC in 2050 is between $2.9 million and $3.3 million.
Investors should note that these long-term predictions can change and, hence, should be taken with a grain of salt.
Bitcoin Price Analysis: Forecasting BTC Targets Using Fibonacci Tool
As discussed in a previous article, Bitcoin price has crossed $100K and hit a new ATH of $104,698 on Wednesday. Considering that BTC crashed nearly 9% between November 25 and 26 and consolidated in this range for the next week or so, this area is key. Using the Fibonacci tool to such relevant areas often reveal key levels where price tends to extend. Adding the Fib tool to the $90.8K to $98.7K range, reveals that the current ATH of $104,698 coincides closely with the 161.8% Fibonacci extension level.
The next key area where Bitcoin price might extend according to the tool is $111,659, which is the 261.8% Fibonacci Extension level.
Although BTC hit a new high in the early Asian session, profit-taking has caused it to drop by 2.31% and currently trades at $96,773.0.
The Relative Strength Index (RSI) and Awesome Oscillator (AO) are both displaying a spike in bullish momentum, which is likely considering the recent uptrend.
Investors can expect a minor retracement as investors book profits without affecting the crypto market’s overall uptrend and bullish outlook
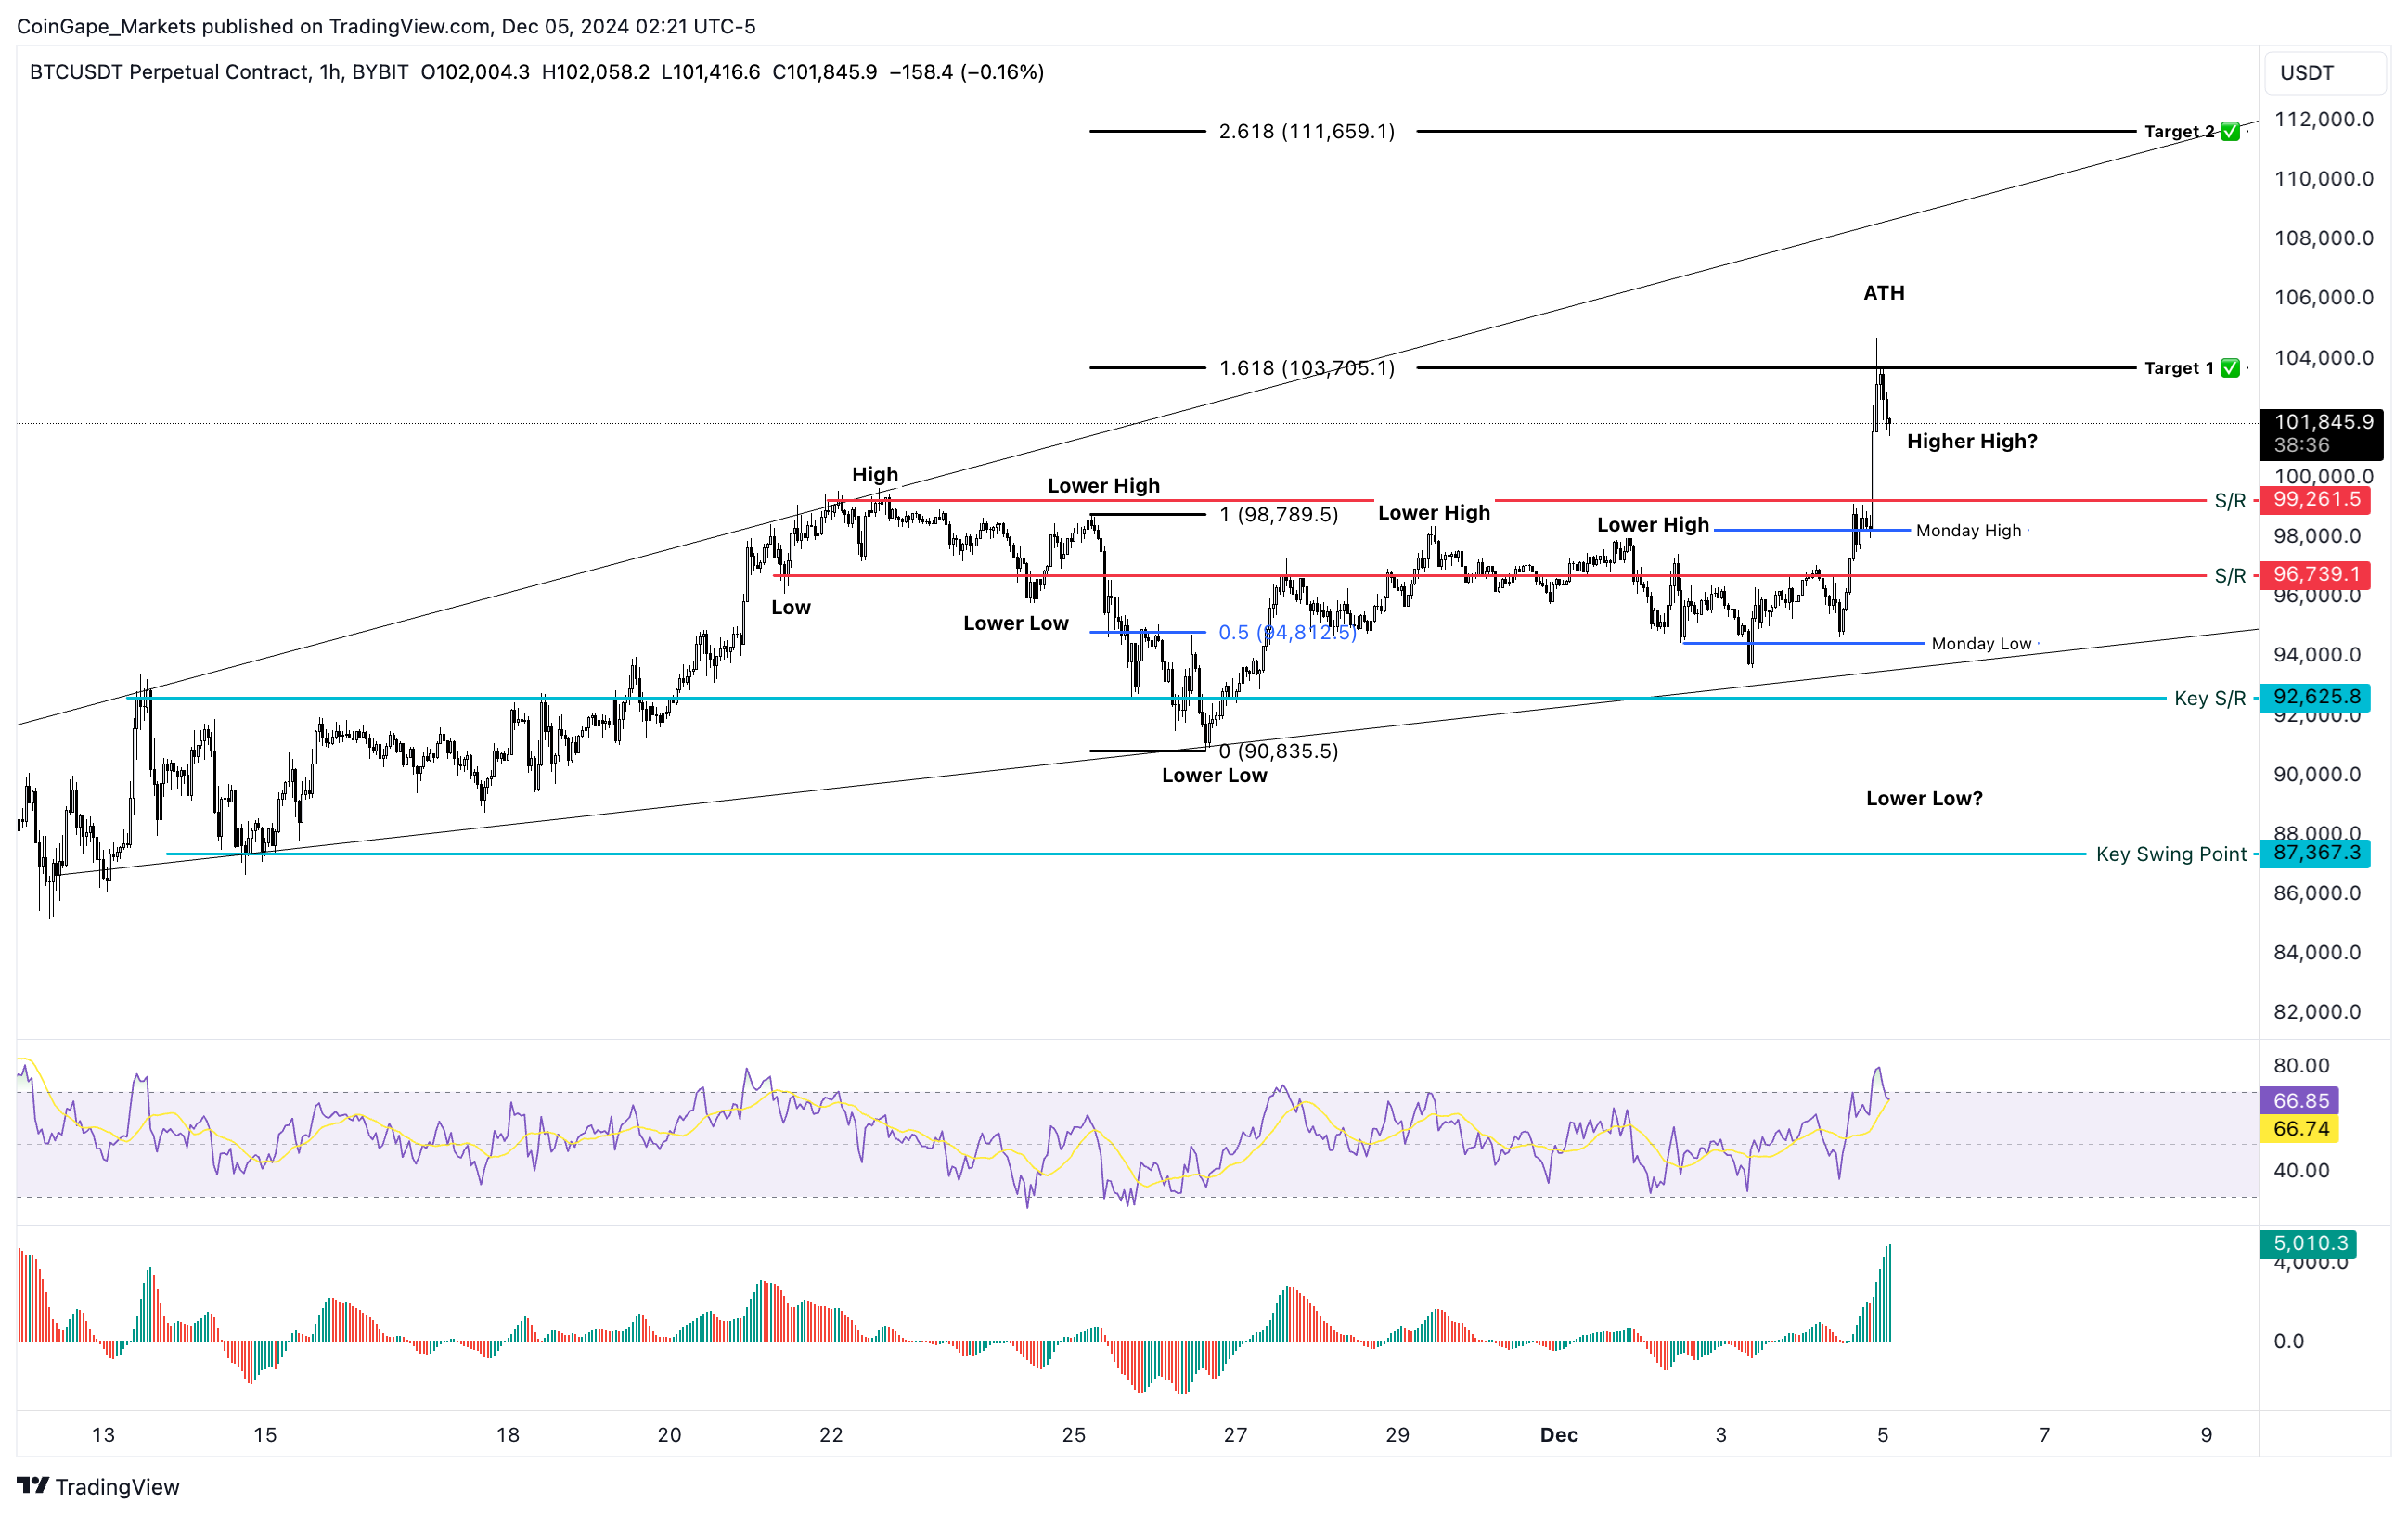
On the contrary, if Bitcoin price slides lower and reenters the $98.7K to $90.8K range with a decisive daily candlestick close, it would invalidate the bullish thesis. In such a case, investors can expect BTC to retest the lower limit of the range at $90.8K.
Recent Posts
- Crypto News
Breaking: Bitwise Files S-1 For SUI ETF With U.S. SEC
Crypto ETF issuer Bitwise is looking to add a SUI ETF to its growing list…
- Crypto News
Crypto Hacks 2025: North Korean Hackers Steal over $2B in ETH and SOL This Year
In 2025, crypto hacks increased significantly. The cybercriminals associated with the North Korean government stole…
- Crypto News
Universal Exchange Bitget Removes Barriers to Traditional Markets, Offers Forex and Gold Trading to Crypto Users
The number one universal exchange Bitget is removing barriers between crypto and traditional finance. It…
- Crypto News
Breaking: U.S. CPI Inflation Falls To 2.7% YoY, Bitcoin Price Climbs
The U.S. CPI inflation came in well below expectations, providing a bullish outlook for Bitcoin…
- Crypto News
Crypto Market Brace for Volatility Ahead of Today’s U.S. CPI Data Release – What to Expect
The crypto market could see some price fluctuations ahead of the release of the major…
- Crypto News
Breaking: Canary Capital Files S-1 for its Staked INJ ETF
Canary Capital amended its staked INJ ETF application with the U.S. Securities and Exchange Commission…