Bitcoin Price Today: What BTC’s $7,770 Move Means For Crypto?

Highlights
- Bitcoin price recovery rally has pushed it past $100,000.
- A bounce from $99,690 could send BTC to retest the ATH at $104,698 or even higher.
- On the contrary, a breakdown of $99,690 could knock BTC down to $98,000.
Bitcoin price today trades at $100,157.0 on 11 PM after hitting a daily high of $102,528.0 today after a -1.18% move on December 18.
Bitcoin Price Today: BTC’s Bullish Comeback
Regardless of the recent market crashes Bitcoin price today is up -1.18% and trades at $100,157.0. With this optimism back, investors can expect altcoins to rally.
*bitcoin price updated as of 11 PM.
Value of BTC trades at $100,157.0, bringing the year-to-date gain from 56% on October 20 to roughly 135% as of December 18. The YTD performance has slumped due to the recent BTC crash. Although many altcoins have shot up over triple digits, Bitcoin is catching up. Ethereum price’s YTD performance is lackluster, stands around 70%, and is well below BTC.
Although Bitcoin is the largest cryptocurrency by market capitalization, Bitcoin’s popularity is due to its first-mover advantage and its being a secure, decentralized network. In addition, many narratives, like digital gold, inflation hedges, and uncorrelated assets, have kept BTC at the forefront of the crypto market since its inception in 2009.
Bitcoin To End 2024 on Bullish Note
Industry veterans’ speculation of a bull run post-US elections was right, and Bitcoin is likely to end November 2024 on a positive note. Many even expect a six-digit target for BTC by the end of November, and this is due to the historical returns. History shows that Bitcoin has always performed massively in the fourth quarter.
With that said, if Bitcoin price hits a new ATH in November or December, Bitcoin’s market capitalization, which stands at $1,982.7 billion, could finally hit the $2 trillion mark.
Bitcoin’s Market Capitalization
While Bitcoin’s market cap hovers around $1,982.7 billion, with Ethereum, the duo controls nearly 65% of the total cryptocurrency market capitalization. Despite the seven-month consolidation, Bitcoin’s $1.93 trillion market cap remains strong, anticipating it reaching $2 trillion before 2025.
BTC: A composition of 24-hour Trading Volume
Being the top crypto has its benefits; more people tend to flock toward the asset. Likewise, BTC’s 24-hour trading volume stands at $69.5 billion. Binance, one of the largest cryptocurrency exchanges, contributes a major portion of this volume. Binance’s share of BTC’s 24-hour trading volume comprises spot and perpetuals trading. While spot volume hovers around 11%, perpetual volume is 41%. Exchanges like OKX, Bitget, etc, follow Binance.
Notable Bitcoin Blockchain Upgrades
With a market cap of $1.93 trillion, it is necessary for the network to remain secure, decentralized, and scalable. This is possible by upgrading the Bitcoin network regularly.
Here are some notable upgrades the Bitcoin network has received or planned to receive since its inception in 2009.
Key Bitcoin Blockchain Upgrades Since 2009
Here are some key milestone upgrades to the Bitcoin network over the past decade.
2020-2024:
- Taproot Upgrade (2021): Improved Bitcoin’s smart contract functionality, allowing for more complex transactions and enhanced privacy.Muir Glacier Upgrade (2020): Delayed the “ice age” that would have slowed down the network, ensuring the continued smooth operation of Bitcoin.
2017-2019:
- Segregated Witness (SegWit) Upgrade (2017): Increased the block size limit, allowing for more transactions to be processed on the network, and improved the overall scalability of Bitcoin.
- Schnorr/Tapscript Upgrade (proposed): Aims to further improve the efficiency and scalability of Bitcoin transactions, but has not yet been activated.
- SegWit2x (canceled): A proposed upgrade that aimed to increase the block size limit, but was ultimately canceled due to lack of consensus.
2015-2016:
- Bitcoin Core 0.12.0 Upgrade (2016): Introduced several improvements, including better wallet management and enhanced security features.
- BIP66 Upgrade (2015): Standardized the way Bitcoin transactions are verified, improving the overall security and reliability of the network.
2013-2014:
- Bitcoin Core 0.9.0 Upgrade (2014): Introduced a new wallet format and improved the overall performance of the Bitcoin client.
- BIP0016 Upgrade (2013): Enabled the use of payment protocol, allowing for more efficient and secure transactions.
2010-2012:
- Pay-to-Script-Hash (P2SH) Upgrade (2012): Introduced a new type of transaction that allows for more complex payment scenarios, improving the overall flexibility of the Bitcoin network.
- Bitcoin Core 0.6.0 Upgrade (2011): Introduced several improvements, including better wallet management and enhanced security features.
2009-2010:
- Bitcoin Core 0.3.0 Upgrade (2009): One of the earliest upgrades to the Bitcoin network, introducing several key features and improvements.
Bitcoin Price Prediction For Next 30 Days
| Date | Price | Change |
|---|---|---|
| December 18, 2025 | 86785.87 | -0.31% |
| December 19, 2025 | 86837.81 | -0.25% |
| December 20, 2025 | 86889.74 | -0.19% |
| December 21, 2025 | 86941.68 | -0.13% |
| December 22, 2025 | 86993.61 | -0.07% |
| December 23, 2025 | 87045.55 | -0.01% |
| December 24, 2025 | 87097.48 | 0.04% |
| December 25, 2025 | 87149.41 | 0.1% |
| December 26, 2025 | 87201.35 | 0.16% |
| December 27, 2025 | 87253.28 | 0.22% |
| December 28, 2025 | 87305.22 | 0.28% |
| December 29, 2025 | 87357.15 | 0.34% |
| December 30, 2025 | 87409.08 | 0.4% |
| December 31, 2025 | 87461.02 | 0.46% |
| January 01, 2026 | 87523.25 | 0.53% |
| January 02, 2026 | 87595.77 | 0.62% |
| January 03, 2026 | 87668.28 | 0.7% |
| January 04, 2026 | 87740.80 | 0.78% |
| January 05, 2026 | 87813.32 | 0.87% |
| January 06, 2026 | 87885.84 | 0.95% |
| January 07, 2026 | 87958.36 | 1.03% |
| January 08, 2026 | 88030.88 | 1.12% |
| January 09, 2026 | 88103.40 | 1.2% |
| January 10, 2026 | 88175.92 | 1.28% |
| January 11, 2026 | 88248.44 | 1.37% |
| January 12, 2026 | 88320.96 | 1.45% |
| January 13, 2026 | 88393.48 | 1.53% |
| January 14, 2026 | 88466.00 | 1.62% |
| January 14, 2026 | 87581.34 | 0.6% |
| January 15, 2026 | 87167.40 | 0.13% |
Based on Coingape’s Bitcoin price prediction, investors can expect a double-digit rally that leads to a peak of $108,918 as of December 31. While there may be a brief correction, BTC’s trend remains bullish. Bitcoin Price Forecast Between 2025 and 2029
Bitcoin Price Prediction Between 2025 & 2029
| Month | Minimum Price | Average Price | Maximum Price | Potential ROI |
|---|---|---|---|---|
| January | $87,889.46 | $87,497.16 | $87,693.31 | 1.6% |
| February | $88,993.06 | $87,585.23 | $88,289.15 | 2.3% |
| March | $90,096.65 | $87,673.31 | $88,884.98 | 3% |
| April | $91,200.24 | $87,761.39 | $89,480.82 | 3.6% |
| May | $92,303.83 | $87,849.46 | $90,076.65 | 4.3% |
| June | $93,407.43 | $87,937.54 | $90,672.49 | 5% |
| July | $94,511.02 | $88,025.62 | $91,268.32 | 5.7% |
| August | $95,614.61 | $88,113.69 | $91,864.15 | 6.4% |
| September | $96,718.20 | $88,201.77 | $92,459.99 | 7.1% |
| October | $97,821.80 | $88,289.85 | $93,055.82 | 7.8% |
| November | $98,925.39 | $88,377.92 | $93,651.66 | 8.5% |
| December | $100,028.98 | $88,466 | $94,247.49 | 9.2% |
| All Time | $93,959.22 | $87,981.58 | $90,970.40 | 5.4% |
| Month | Minimum Price | Average Price | Maximum Price | Potential ROI |
|---|---|---|---|---|
| January | $107,377.82 | $97,337.42 | $104,685.70 | 21.3% |
| February | $114,726.65 | $106,208.83 | $115,123.91 | 33.3% |
| March | $122,075.49 | $115,080.25 | $125,562.12 | 45.4% |
| April | $129,424.32 | $123,951.67 | $136,000.33 | 57.5% |
| May | $136,773.16 | $132,823.08 | $146,438.54 | 69.6% |
| June | $144,121.99 | $141,694.50 | $156,876.75 | 81.7% |
| July | $151,470.83 | $150,565.92 | $167,314.95 | 93.8% |
| August | $158,819.66 | $159,437.33 | $177,753.16 | 105.9% |
| September | $166,168.50 | $168,308.75 | $188,191.37 | 118% |
| October | $173,517.33 | $177,180.17 | $198,629.58 | 130.1% |
| November | $180,866.17 | $186,051.58 | $209,067.79 | 142.2% |
| December | $188,215 | $194,923 | $219,506 | 154.3% |
| All Time | $147,796.41 | $146,130.21 | $162,095.85 | 87.8% |
| Month | Minimum Price | Average Price | Maximum Price | Potential ROI |
|---|---|---|---|---|
| January | $195,481 | $202,279.75 | $228,347.58 | 164.5% |
| February | $202,747 | $209,636.50 | $237,189.17 | 174.7% |
| March | $210,013 | $216,993.25 | $246,030.75 | 185% |
| April | $217,279 | $224,350 | $254,872.33 | 195.2% |
| May | $224,545 | $231,706.75 | $263,713.92 | 205.5% |
| June | $231,811 | $239,063.50 | $272,555.50 | 215.7% |
| July | $239,077 | $246,420.25 | $281,397.08 | 225.9% |
| August | $246,343 | $253,777 | $290,238.67 | 236.2% |
| September | $253,609 | $261,133.75 | $299,080.25 | 246.4% |
| October | $260,875 | $268,490.50 | $307,921.83 | 256.7% |
| November | $268,141 | $275,847.25 | $316,763.42 | 266.9% |
| December | $275,407 | $283,204 | $325,605 | 277.2% |
| All Time | $235,444 | $242,741.88 | $276,976.29 | 220.8% |
| Month | Minimum Price | Average Price | Maximum Price | Potential ROI |
|---|---|---|---|---|
| January | $285,565.25 | $293,892.50 | $338,177.42 | 291.7% |
| February | $295,723.50 | $304,581 | $350,749.83 | 306.3% |
| March | $305,881.75 | $315,269.50 | $363,322.25 | 320.8% |
| April | $316,040 | $325,958 | $375,894.67 | 335.4% |
| May | $326,198.25 | $336,646.50 | $388,467.08 | 350% |
| June | $336,356.50 | $347,335 | $401,039.50 | 364.5% |
| July | $346,514.75 | $358,023.50 | $413,611.92 | 379.1% |
| August | $356,673 | $368,712 | $426,184.33 | 393.7% |
| September | $366,831.25 | $379,400.50 | $438,756.75 | 408.2% |
| October | $376,989.50 | $390,089 | $451,329.17 | 422.8% |
| November | $387,147.75 | $400,777.50 | $463,901.58 | 437.3% |
| December | $397,306 | $411,466 | $476,474 | 451.9% |
| All Time | $341,435.63 | $352,679.25 | $407,325.71 | 371.8% |
| Month | Minimum Price | Average Price | Maximum Price | Potential ROI |
|---|---|---|---|---|
| January | $413,770.83 | $428,465.33 | $493,358.42 | 471.5% |
| February | $430,235.67 | $445,464.67 | $510,242.83 | 491% |
| March | $446,700.50 | $462,464 | $527,127.25 | 510.6% |
| April | $463,165.33 | $479,463.33 | $544,011.67 | 530.1% |
| May | $479,630.17 | $496,462.67 | $560,896.08 | 549.7% |
| June | $496,095 | $513,462 | $577,780.50 | 569.2% |
| July | $512,559.83 | $530,461.33 | $594,664.92 | 588.8% |
| August | $529,024.67 | $547,460.67 | $611,549.33 | 608.4% |
| September | $545,489.50 | $564,460 | $628,433.75 | 627.9% |
| October | $561,954.33 | $581,459.33 | $645,318.17 | 647.5% |
| November | $578,419.17 | $598,458.67 | $662,202.58 | 667% |
| December | $594,884 | $615,458 | $679,087 | 686.6% |
| All Time | $504,327.42 | $521,961.67 | $586,222.71 | 579% |
In the next year, aka 2025, Bitcoin price is likely to stay well above the six-digit territory and shows no signs of correction below it. Coingape’s Bitcoin price prediction data reveals a peak of $104,280.26 in February 2025.
Bitcoin Price Prediction Between 2030 and 2050
| Month | Minimum Price | Average Price | Maximum Price | Potential ROI |
|---|---|---|---|---|
| January | $617,065.67 | $637,976.67 | $709,750.17 | 722.1% |
| February | $639,247.33 | $660,495.33 | $740,413.33 | 757.6% |
| March | $661,429 | $683,014 | $771,076.50 | 793.1% |
| April | $683,610.67 | $705,532.67 | $801,739.67 | 828.7% |
| May | $705,792.33 | $728,051.33 | $832,402.83 | 864.2% |
| June | $727,974 | $750,570 | $863,066 | 899.7% |
| July | $750,155.67 | $773,088.67 | $893,729.17 | 935.2% |
| August | $772,337.33 | $795,607.33 | $924,392.33 | 970.7% |
| September | $794,519 | $818,126 | $955,055.50 | 1006.2% |
| October | $816,700.67 | $840,644.67 | $985,718.67 | 1041.8% |
| November | $838,882.33 | $863,163.33 | $1,016,381.83 | 1077.3% |
| December | $861,064 | $885,682 | $1,047,045 | 1112.8% |
| All Time | $739,064.83 | $761,829.33 | $878,397.58 | 917.5% |
| Month | Minimum Price | Average Price | Maximum Price | Potential ROI |
|---|---|---|---|---|
| January | $893,600.33 | $919,119.08 | $1,083,647 | 1155.2% |
| February | $926,136.67 | $952,556.17 | $1,120,249 | 1197.6% |
| March | $958,673 | $985,993.25 | $1,156,851 | 1240% |
| April | $991,209.33 | $1,019,430.33 | $1,193,453 | 1282.4% |
| May | $1,023,745.67 | $1,052,867.42 | $1,230,055 | 1324.8% |
| June | $1,056,282 | $1,086,304.50 | $1,266,657 | 1367.2% |
| July | $1,088,818.33 | $1,119,741.58 | $1,303,259 | 1409.6% |
| August | $1,121,354.67 | $1,153,178.67 | $1,339,861 | 1452% |
| September | $1,153,891 | $1,186,615.75 | $1,376,463 | 1494.4% |
| October | $1,186,427.33 | $1,220,052.83 | $1,413,065 | 1536.8% |
| November | $1,218,963.67 | $1,253,489.92 | $1,449,667 | 1579.2% |
| December | $1,251,500 | $1,286,927 | $1,486,269 | 1621.6% |
| All Time | $1,072,550.17 | $1,103,023.04 | $1,284,958 | 1388.4% |
| Month | Minimum Price | Average Price | Maximum Price | Potential ROI |
|---|---|---|---|---|
| January | $1,300,715.75 | $1,338,552.75 | $1,545,122.92 | 1689.7% |
| February | $1,349,931.50 | $1,390,178.50 | $1,603,976.83 | 1757.9% |
| March | $1,399,147.25 | $1,441,804.25 | $1,662,830.75 | 1826.1% |
| April | $1,448,363 | $1,493,430 | $1,721,684.67 | 1894.2% |
| May | $1,497,578.75 | $1,545,055.75 | $1,780,538.58 | 1962.4% |
| June | $1,546,794.50 | $1,596,681.50 | $1,839,392.50 | 2030.6% |
| July | $1,596,010.25 | $1,648,307.25 | $1,898,246.42 | 2098.7% |
| August | $1,645,226 | $1,699,933 | $1,957,100.33 | 2166.9% |
| September | $1,694,441.75 | $1,751,558.75 | $2,015,954.25 | 2235.1% |
| October | $1,743,657.50 | $1,803,184.50 | $2,074,808.17 | 2303.3% |
| November | $1,792,873.25 | $1,854,810.25 | $2,133,662.08 | 2371.4% |
| December | $1,842,089 | $1,906,436 | $2,192,516 | 2439.6% |
| All Time | $1,571,402.38 | $1,622,494.38 | $1,868,819.46 | 2064.7% |
| Month | Minimum Price | Average Price | Maximum Price | Potential ROI |
|---|---|---|---|---|
| January | $1,908,609.25 | $1,973,948.75 | $2,276,708.17 | 2537.1% |
| February | $1,975,129.50 | $2,041,461.50 | $2,360,900.33 | 2634.6% |
| March | $2,041,649.75 | $2,108,974.25 | $2,445,092.50 | 2732.2% |
| April | $2,108,170 | $2,176,487 | $2,529,284.67 | 2829.7% |
| May | $2,174,690.25 | $2,243,999.75 | $2,613,476.83 | 2927.2% |
| June | $2,241,210.50 | $2,311,512.50 | $2,697,669 | 3024.7% |
| July | $2,307,730.75 | $2,379,025.25 | $2,781,861.17 | 3122.2% |
| August | $2,374,251 | $2,446,538 | $2,866,053.33 | 3219.8% |
| September | $2,440,771.25 | $2,514,050.75 | $2,950,245.50 | 3317.3% |
| October | $2,507,291.50 | $2,581,563.50 | $3,034,437.67 | 3414.8% |
| November | $2,573,811.75 | $2,649,076.25 | $3,118,629.83 | 3512.3% |
| December | $2,640,332 | $2,716,589 | $3,202,822 | 3609.8% |
| All Time | $2,274,470.63 | $2,345,268.88 | $2,739,765.08 | 3073.5% |
| Month | Minimum Price | Average Price | Maximum Price | Potential ROI |
|---|---|---|---|---|
| January | $2,728,184.50 | $2,811,669.67 | $3,268,702.33 | 3686.2% |
| February | $2,816,037 | $2,906,750.33 | $3,334,582.67 | 3762.5% |
| March | $2,903,889.50 | $3,001,831 | $3,400,463 | 3838.8% |
| April | $2,991,742 | $3,096,911.67 | $3,466,343.33 | 3915.1% |
| May | $3,079,594.50 | $3,191,992.33 | $3,532,223.67 | 3991.4% |
| June | $3,167,447 | $3,287,073 | $3,598,104 | 4067.7% |
| July | $3,255,299.50 | $3,382,153.67 | $3,663,984.33 | 4144% |
| August | $3,343,152 | $3,477,234.33 | $3,729,864.67 | 4220.3% |
| September | $3,431,004.50 | $3,572,315 | $3,795,745 | 4296.6% |
| October | $3,518,857 | $3,667,395.67 | $3,861,625.33 | 4372.9% |
| November | $3,606,709.50 | $3,762,476.33 | $3,927,505.67 | 4449.3% |
| December | $3,694,562 | $3,857,557 | $3,993,386 | 4525.6% |
| All Time | $3,211,373.25 | $3,334,613.33 | $3,631,044.17 | 4105.9% |
| Month | Minimum Price | Average Price | Maximum Price | Potential ROI |
|---|---|---|---|---|
| January | $3,794,170.25 | $3,957,165.25 | $4,111,104.92 | 4661.9% |
| February | $3,893,778.50 | $4,056,773.50 | $4,228,823.83 | 4798.3% |
| March | $3,993,386.75 | $4,156,381.75 | $4,346,542.75 | 4934.6% |
| April | $4,092,995 | $4,255,990 | $4,464,261.67 | 5071% |
| May | $4,192,603.25 | $4,355,598.25 | $4,581,980.58 | 5207.3% |
| June | $4,292,211.50 | $4,455,206.50 | $4,699,699.50 | 5343.7% |
| July | $4,391,819.75 | $4,554,814.75 | $4,817,418.42 | 5480% |
| August | $4,491,428 | $4,654,423 | $4,935,137.33 | 5616.4% |
| September | $4,591,036.25 | $4,754,031.25 | $5,052,856.25 | 5752.8% |
| October | $4,690,644.50 | $4,853,639.50 | $5,170,575.17 | 5889.1% |
| November | $4,790,252.75 | $4,953,247.75 | $5,288,294.08 | 6025.5% |
| December | $4,889,861 | $5,052,856 | $5,406,013 | 6161.8% |
| All Time | $4,342,015.63 | $4,505,010.63 | $4,758,558.96 | 5411.9% |
Roughly five years from now, aka 2030, Bitcoin’s price will see an explosion to the upside, with an all-time high of $774,474 in the aforementioned year. In the same period, BTC could reach a low of $465,154.42. Based on CoinGape predictions, the average price of BTC in 2050 is between $2.9 million and $3.3 million.
Investors should note that these long-term predictions can change and, hence, should be taken with a grain of salt.
Bitcoin Price Analysis: Why BTC Shot up $7,770 Yesterday?
After crashing 4% on December 10, Bitcoin formed a local bottom at $94,190. This move was followed by an 8.25% rally which increased BTC’s value by $7,770 to $101,961. The sudden uptrend comes after two liquidation events that wiped on positions worth $1.5 billion and $1.7 billion on December 5 and 9, respectively.
During bull runs, these flash crashes are normal and are net bullish for the crypto ecosystem as they reset the high leverage present in the system, allowing markets to climb much higher. As a result of the liquidation event, prices often recover in an impulsive move, suggesting that the trend is back on track.
On the one-hour chart, Bitcoin trades above the Value Area High (VAH) of $99,690. Going forward, investors can expect a minor retracement that retests the VAH. If the uptrend is true, BTC bulls need to defend this key barrier. A bounce here could set the stage for the next leg up.
Under these circumstances, a bounce from $99,690 could send Bitcoin price up by 5.10% to revisit the ATH of $104,698.
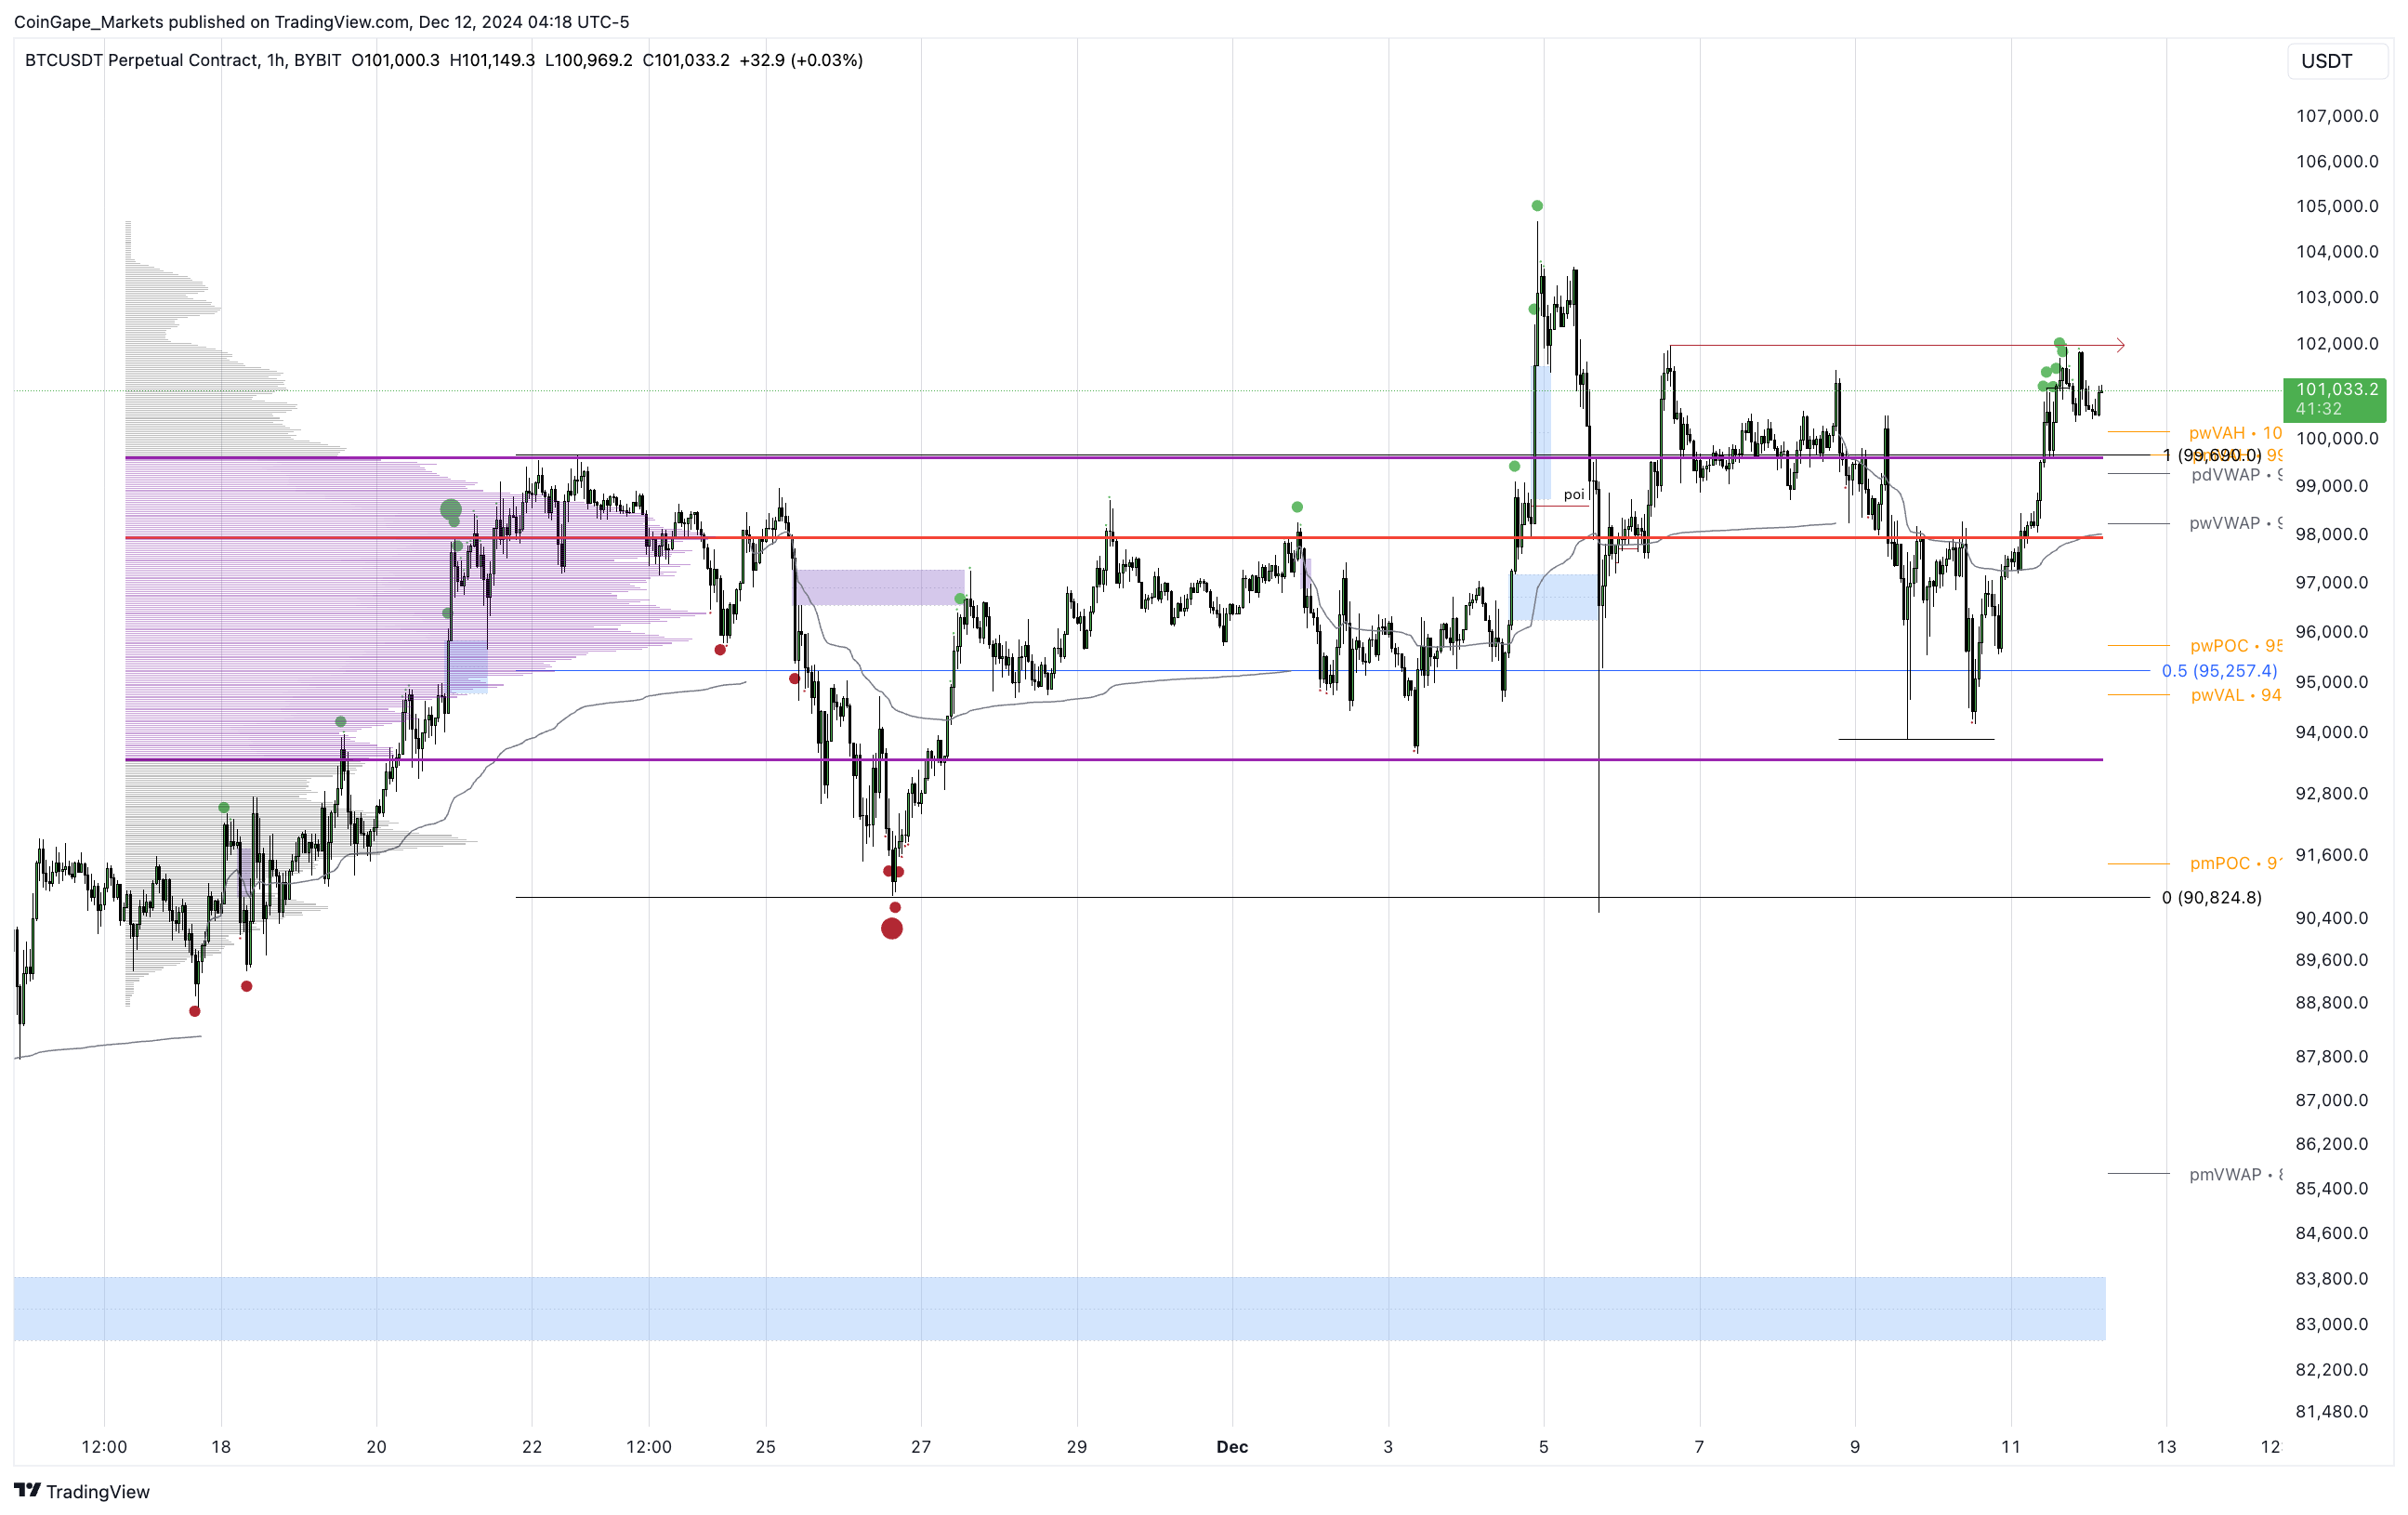
On the other hand, if the breakout has a lack of interested buyers, Bitcoin price would breach $99,690. Such a development could see BTC reenter the volume profile’s range that extends from $93,509 to $99,690. This indicator shows that profile of the volume traded between November 11 and today. The VAH and VAL are high and low value areas. The red line is known as the Point of Control (POC), which is where the highest volume was traded. A breakdown of $99,690 could see BTC revisit the POC at $98,000.
Recent Posts
- Crypto News
Crypto Market Brace for Volatility Ahead of Today’s U.S. CPI Data Release – What to Expect
The crypto market could see some price fluctuations ahead of the release of the major…
- Crypto News
Breaking: Canary Capital Files S-1 for its Staked INJ ETF
Canary Capital amended its staked INJ ETF application with the U.S. Securities and Exchange Commission…
- Crypto News
US FED, SEC Just Boost Institutional Adoption, Tokenization, Liquidity, Will Crypto Market Recover?
The US Federal Reserve (Fed) and the Securities and Exchange Commission (SEC) announce key crypto…
- Crypto News
Another Crypto Sell-Off Ahead? MSCI Review Sparks $15B Market Crash Fears
A new report has warned that a potential decision by MSCI to exclude digital asset…
- Altcoin News
XRP Price Could Crash to $1 on Double Top Pattern, Predicts Peter Brandt
Veteran trader Peter Brandt turned bearish on XRP price, moving away from his recent long-term…
- Crypto News
USD1 Gets Major Boost as Trump’s World Liberty Plans Treasury-Backed Expansion
World Liberty has launched a new proposal to use some of the project’s treasury holdings…