 Buy $GGs
Bitcoin (BTC) Undervalued But Charts Show Further Correction Pending


Over the last week, the Bitcoin (BTC) price has remained stable holding its neck just above the $26,000 level keeping investors confused about where it is moving next. As of now, some of the on-chain indicators show undervaluation for Bitcoin, however, weakness continues to persist on the charts.
Bitcoin’s NVM ratio has recently risen to 0.52, falling below the 0.6 threshold typically signaling undervaluation. The “NVM ratio” is a measure that examines the correlation between the logarithm of Bitcoin’s market value and the square of its daily active users.
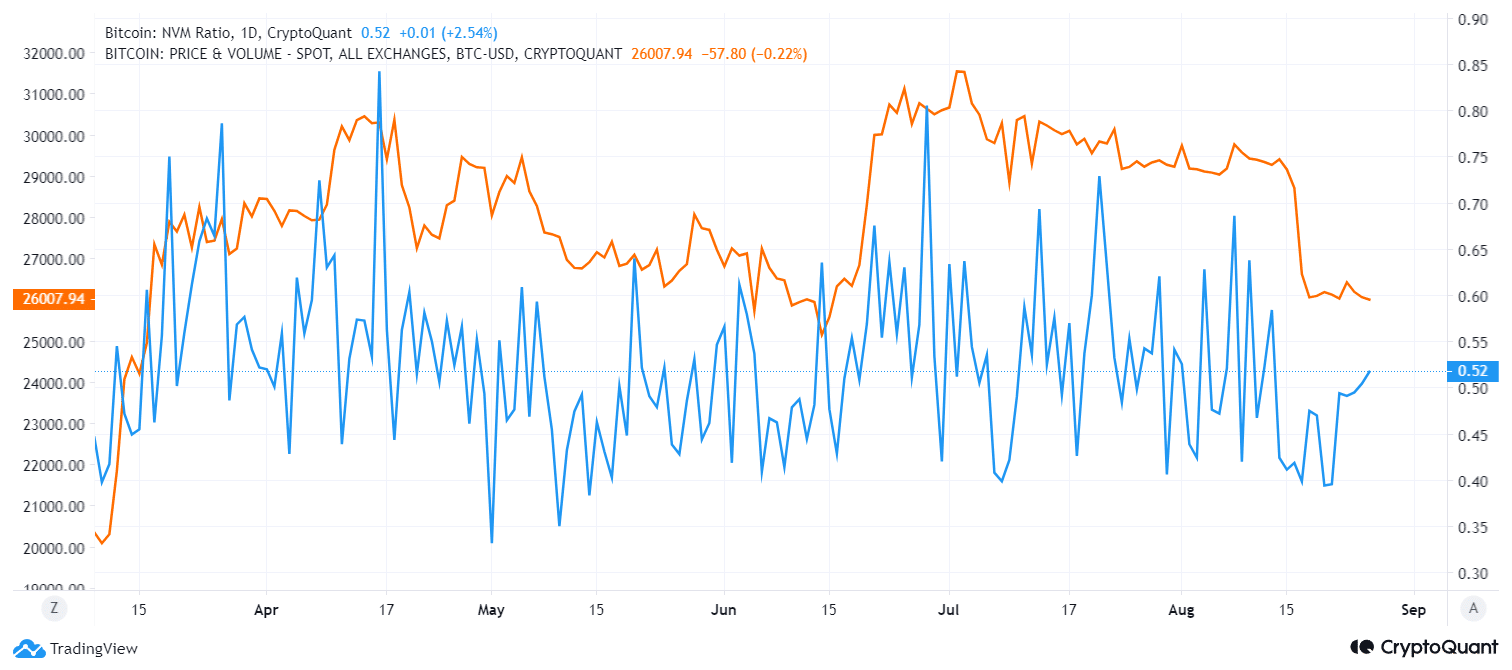
When the NVM ratio is high, Bitcoin is considered overvalued; conversely, a low ratio suggests undervaluation. The present downward trend of this metric implies the potential for a price rise, given the positive network activity.
Bitcoin (BTC) Price Shows Weakness on Charts
Bitcoin’s SuperTrend indicator has been flashing sell signals while hinting at a deeper price correction. To confirm any bullish reversal, the BTC price needs to close above the $29,500 level, which is 14% higher than the current levels. If Bitcoin fails to recover above this, a bigger correction could be on the cards.
Notice the precision of the SuperTrend indicator anticipating when to buy and sell #Bitcoin! It recently signaled a sell, hinting at a deeper price correction.
For a bullish reversal, $BTC needs to close above $29,500. If not, brace for more losses. pic.twitter.com/TFQ3Djtiqj
— Ali (@ali_charts) August 27, 2023
On the technical chart, Bitcoin continues to show signs of weakness. The upper trend line of the triangle pattern is still offering resistance to Bitcoin’s price, indicating that bearish traders are selling during upward movements. This has maintained BTC’s price within the $25,300 to $26,800 range. Currently, the BTC price sits at $26,041, with a slight 0.02% increase in the last 24 hours.
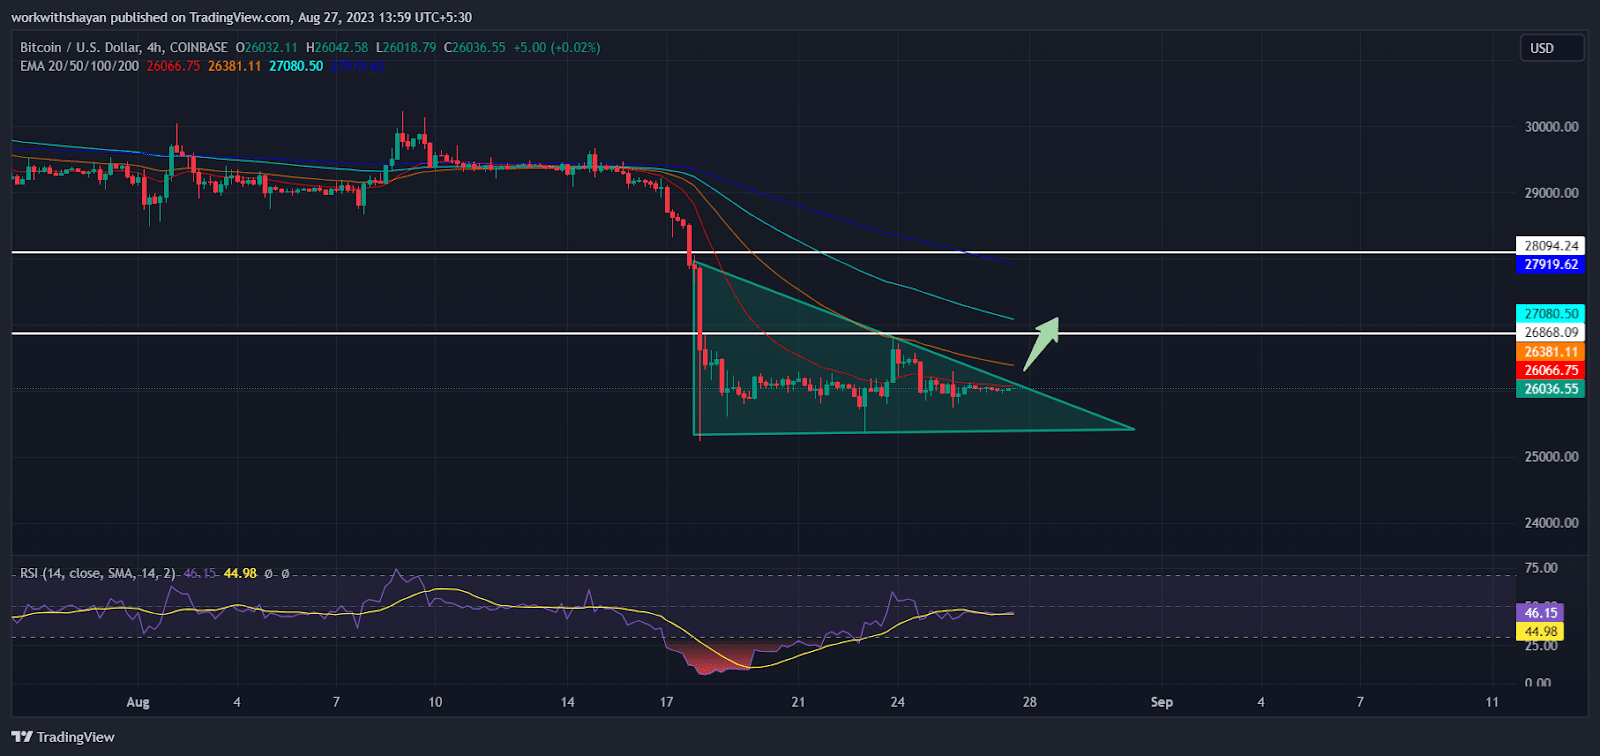
Consolidation around the triangle pattern’s lower boundary would suggest a lack of aggressive buying from bullish traders. Presently, the bulls are striving to push the BTC price above the EMA20 moving average to reinforce their long positions. However, the RSI level remains below the midline, giving bears an upper hand in preventing an immediate surge.
Should the price dip below $25,300, it could trigger stop-loss orders among multiple traders, potentially initiating a cascade of long position liquidations. This scenario might lead to a decline in BTC’s price towards the critical $24,700 support level.
Play 10,000+ Casino Games at BC Game with Ease
- Instant Deposits And Withdrawals
- Crypto Casino And Sports Betting
- Exclusive Bonuses And Rewards


Why Trust CoinGape
CoinGape has covered the cryptocurrency industry since 2017, aiming to provide informative insights Read more… to our readers. Our journal analysts bring years of experience in market analysis and blockchain technology to ensure factual accuracy and balanced reporting. By following our Editorial Policy, our writers verify every source, fact-check each story, rely on reputable sources, and attribute quotes and media correctly. We also follow a rigorous Review Methodology when evaluating exchanges and tools. From emerging blockchain projects and coin launches to industry events and technical developments, we cover all facets of the digital asset space with unwavering commitment to timely, relevant information.

Delivered every day.
- Insights that move markets
- 100,000 active subscribers
Related Articles


- US-Iran War: Reports Confirm Bombings In UAE, Bahrain and Kuwait As Crypto Market Makes Recovery
- XRP Price Dips on US-Iran Conflict, But Capitulation Signals March Rebound
- Crypto Market at Risk as U.S.–Iran War Threatens Inflation With Oil Price Surge
- Polymarket U.S.–Iran Strike Bets Fuel Insider Trading Speculation as Crypto Traders Net $1.2M
- Cardano’s DeFi TVL Climbs as USDCx Stablecoin Launches on Network
- Top Analyst Predicts Pi Network Price Bottom, Flags Key Catalysts
- Will Ethereum Price Hold $1,900 Level After Five Weeks of $563M ETF Selling?
- Top 2 Price Predictions Ethereum and Solana Ahead of March 1 Clarity Act Stablecoin Deadline
- Pi Network Price Prediction Ahead of Protocol Upgrades Deadline on March 1
- XRP Price Outlook As Jane Street Lawsuit Sparks Shift in Morning Sell-Off Trend
- Dogecoin, Cardano, and Chainlink Price Prediction As Crypto Market Rebounds


