Bitcoin Price Analysis: $58,941 Level Is Crucial For BTC’s Bullish Breakout


Bitcoin price is down 5.34% in the past 24 hours as it trades in the red at $56,762. BTC’s daily trading volume has been increasing, in contrast with the price and currently stands at $1,070,511,404,267 having leaped 22% over the past 24 hours. Bitcoin’s market capitalisation has dropped by 5.04% to $1.07 trillion over the same time frame.
All these are bearish signs that indicate the continuing price correction displayed pioneer cryptocurrency.
How Low Can Bitcoin Price Go
Bitcoin has dropped 18.25% from the November 10 all-time high (ATH) above $69,000 to the current price around $56,762. This price action has created a descending parallel channel on the four-hour chart with the Bitcoin price being continuously rejected by the middle boundary of the channel.
BTC price is facing immediate resistance from the $57,500 level. Flipping this level into support is crucial for BTC reversing the downtrend.
A decisive bullish breakout will be seen when BTC overcomes the resistance posed by the middle boundary of the falling channel at $58,941 confirming a bullish breakout. After which a rally to new ATH at $71,075 which is the target of the governing chart pattern will be next logical move. This will represent a 25% upswing from the current price.
The position of the RSI in the oversold region points to a trend reversal which validates BTC’s optimistic outlook.
BTC/USD Four-Hour Chart
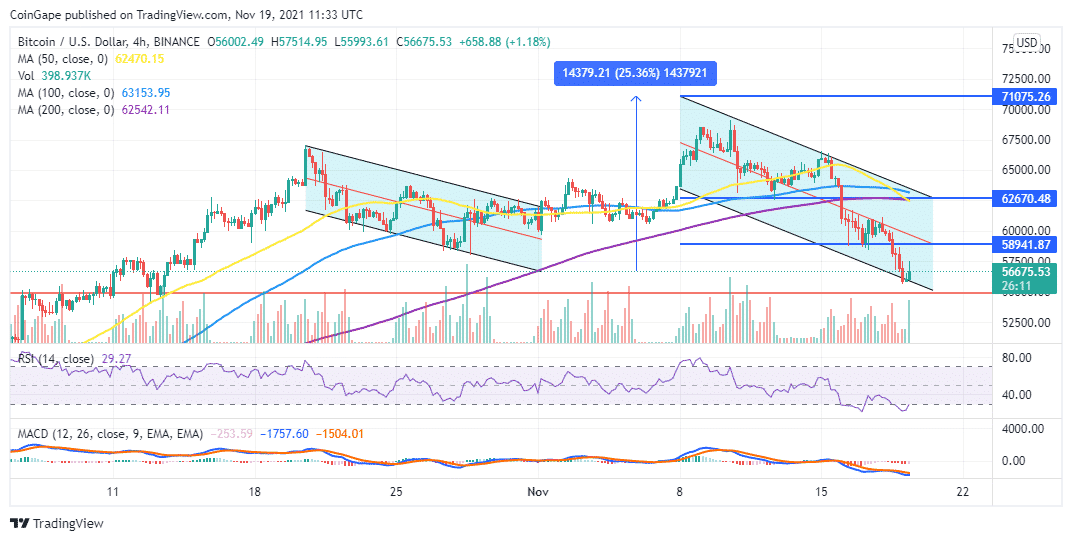
Failure to break rise above the $58,941 level could see the big crypto drop to tag the lower boundary of the prevailing chart pattern at $55,134. If this support level fails to hold, BTC could drop further reaching towards the $52,500 support wall.
The down-sloping moving averages and position of Relative Strength (RSI) indicator in the oversold zone suggests that the bears are currently in control of BTC price, validating the bearish narrative.
Moreover, the downward movement of the Moving Average Convergence Divergence (MACD) indicator below the zero in the negative region accentuates Bitcoin’s pessimistic outlook.

Why Trust CoinGape
CoinGape has covered the cryptocurrency industry since 2017, aiming to provide informative insights Read more… to our readers. Our journal analysts bring years of experience in market analysis and blockchain technology to ensure factual accuracy and balanced reporting. By following our Editorial Policy, our writers verify every source, fact-check each story, rely on reputable sources, and attribute quotes and media correctly. We also follow a rigorous Review Methodology when evaluating exchanges and tools. From emerging blockchain projects and coin launches to industry events and technical developments, we cover all facets of the digital asset space with unwavering commitment to timely, relevant information.

Delivered every day.
- Insights that move markets
- 100,000 active subscribers
Related Articles


- Trump-Linked World Liberty Targets $9T Forex Market With “World Swap” Launch
- Analysts Warn BTC Price Crash to $10K as Glassnode Flags Structural Weakness
- $1B Binance SAFU Fund Enters Top 10 Bitcoin Treasuries, Overtakes Coinbase
- Breaking: ABA Tells OCC to Delay Charter Review for Ripple, Coinbase, Circle
- Brian Armstrong Offloads $101M in Coinbase Stock Amid COIN’s Steep Decline
- Pi Network Price Prediction as Mainnet Upgrade Deadline Nears on Feb 15
- XRP Price Outlook Amid XRP Community Day 2026
- Ethereum Price at Risk of a 30% Crash as Futures Open Interest Dive During the Crypto Winter
- Ethereum Price Prediction Ahead of Roadmap Upgrades and Hegota Launch
- BTC Price Prediction Ahead of US Jobs Report, CPI Data and U.S. Government Shutdown
- Ripple Price Prediction As Goldman Sachs Discloses Crypto Exposure Including XRP


