Bitcoin Price Analysis: BTC Tops $12,000 As The Crypto Market Turns Bullish
- Bitcoin slices through the critical level of $12,000 for the first time since early September.
- It is doubtful that Bitcoin will sustain the uptrend to test higher hurdles at $12,200 and $12,400.
Bitcoin finally smashed the resistance at $12,000 just like our predictions have pointed out in the recent past. The last time the bell weather cryptocurrency traded above this zone was at the beginning of September. On the other hand, BTC/USD brushed shoulders with $12,500 in August.
At the time of writing, the flagship cryptocurrency is trading at $12,022 amid a developing bullish momentum. The Moving Average Convergence Divergence (MACD) is extending the action higher in the positive territory. A bullish divergence above the MACD puts bulls strongly in control.
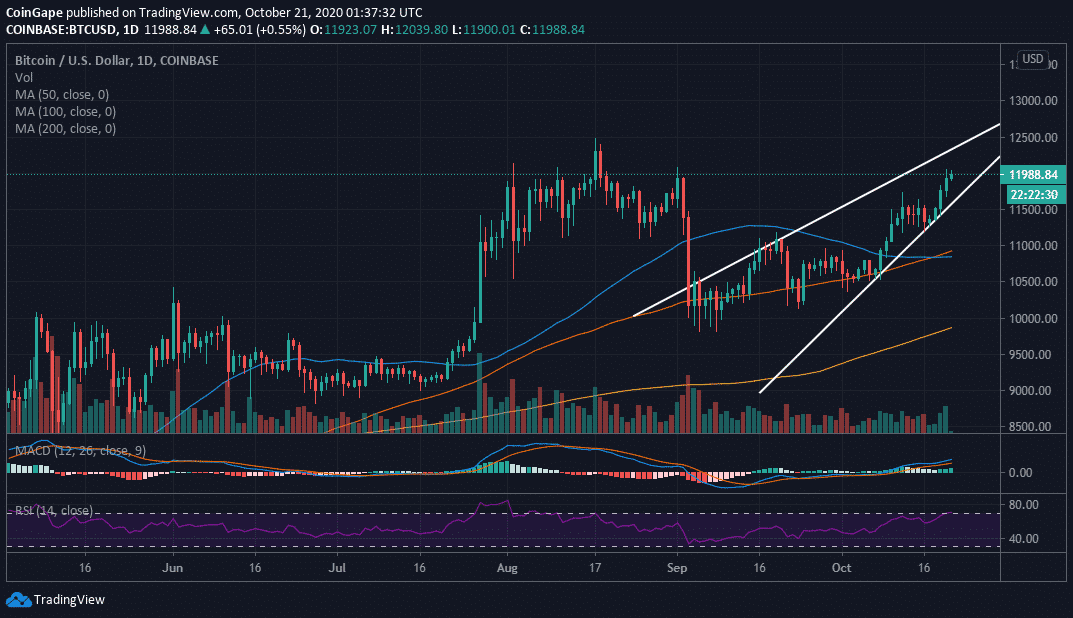
BTC/USD daily chart
Despite the majestic price action above $12,000, it is not certain that buyers will sustain the uptrend. Resistance is anticipated at $12,200 and $12,400. In addition, the rising wedge pattern on the daily chart hints that a reversal could be in the offing.
The Relative Strength Index (RSI) is currently in the overbought region. Bitcoin might continue building on the momentum created after slicing through the $12,000 hurdle. However, it is essential to be aware that overbought conditions signal an eventual reversal of an asset.
In the event bears regain control, BTC will look forward to support at $11,800, $11,500 and $11,200. With the 100 Simple Moving Average (SMA) above the short term 50 SMA in the daily timeframe, it means that a correction is imminent.
Bitcoin Intraday Levels
Spot rate: $11,992
Relative change: 65
Percentage change: 0.55%
Trend: Bullish
Volatility: Low
Recent Posts
- Crypto News
Breaking: Bitwise Files S-1 For SUI ETF With U.S. SEC
Crypto ETF issuer Bitwise is looking to add a SUI ETF to its growing list…
- Crypto News
Crypto Hacks 2025: North Korean Hackers Steal over $2B in ETH and SOL This Year
In 2025, crypto hacks increased significantly. The cybercriminals associated with the North Korean government stole…
- Crypto News
Universal Exchange Bitget Removes Barriers to Traditional Markets, Offers Forex and Gold Trading to Crypto Users
The number one universal exchange Bitget is removing barriers between crypto and traditional finance. It…
- Crypto News
Breaking: U.S. CPI Inflation Falls To 2.7% YoY, Bitcoin Price Climbs
The U.S. CPI inflation came in well below expectations, providing a bullish outlook for Bitcoin…
- Crypto News
Crypto Market Brace for Volatility Ahead of Today’s U.S. CPI Data Release – What to Expect
The crypto market could see some price fluctuations ahead of the release of the major…
- Crypto News
Breaking: Canary Capital Files S-1 for its Staked INJ ETF
Canary Capital amended its staked INJ ETF application with the U.S. Securities and Exchange Commission…