Bitcoin Price Analysis: The BTC/USD Falling Wedge Scenario, Why $10k and $10.5k Are The Bigger Picture?


- Bitcoin bulls stop declines above $9,300 after $9,400 failed to hold; bulls still yearn for $10,000.
- The falling wedge pattern becomes Bitcoin bulls’ most anticipated boost above $10,000.
Over the last couple of weeks, Bitcoin has been struggling to break the psychological hurdle at $10,000. Glancing higher, a short-lived rally in the first week of June saw its momentum fizzle out marginally above $10,400, leaving $10,500 untested and definitely unconquered. Meanwhile, in this same month, BTC/USD has tumbled, testing support at $9,300. The recovery that ensued has not been strong enough to catapult Bitcoin past $9,600.
The BTC/USD Daily Chart Analysis
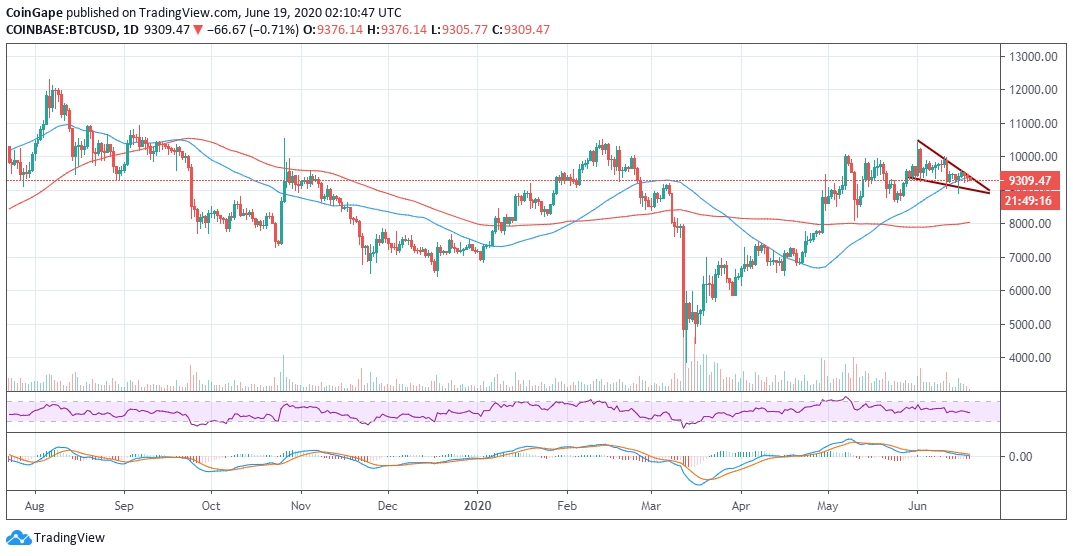
Bitcoin price is trading at $9,321 in the wake of a 0.57% loss. Support has since been established at $9,300 after Thursday attempt to stick above $9,400 failed to yield as expected. Generally, the prevailing trend for the leading cryptocurrency is bearish. The good thing is that volatility is low, therefore, rapid price actions remain limited.
A closer look at the chart shows that Bitcoin has a bearish inclination mainly supported by the Relative Strength Index (RSI) and the Moving Average Convergence Divergence (MACD). The RSI has a slightly negative gradient, which means that buying pressure is not absent; probably the reason why Bitcoin has stayed above $9,300 despite the loss from levels above $9,400. The MACD also puts emphasis on the existent of bullish pressure but of course, only to some extent. The MACD also features a bearish divergence that highlights a growing bearish grip.
BTC/USD daily chart
The Falling Wedge Scenario
Since yesterday, we have been looking keenly at this falling wedge pattern; currently the only ‘saving grace’ for the bulls’ mission of breaking $10,000 and $10,500. Bitcoin is dealing with the high congestion of sellers at the descending trendline. The breakout above this line is the only factor I anticipate to catapult Bitcoin past $10,000 towards $10,500.
Bitcoin Key Intraday Levels
Spot rate: $9,321
Relative change: -62
Percentage change: -0.57%
Trend: bearish
Volatility: Low
Why Trust CoinGape
CoinGape has covered the cryptocurrency industry since 2017, aiming to provide informative insights Read more… to our readers. Our journal analysts bring years of experience in market analysis and blockchain technology to ensure factual accuracy and balanced reporting. By following our Editorial Policy, our writers verify every source, fact-check each story, rely on reputable sources, and attribute quotes and media correctly. We also follow a rigorous Review Methodology when evaluating exchanges and tools. From emerging blockchain projects and coin launches to industry events and technical developments, we cover all facets of the digital asset space with unwavering commitment to timely, relevant information.
Delivered every day.
- Insights that move markets
- 100,000 active subscribers
Related Articles


- Trump’s World Liberty Bank Charter Advances as OCC Rejects Senator Warren Criticism
- Gemini Lawsuit Dismissed: SEC Drops Case After Full Investor Recovery
- Crypto Market Bill Markup Now Uncertain As Senate Cancels Monday Sessions
- CLARITY Act: Gillibrand Sees Path Forward for Crypto Bill as Democrats Clash Over Presidential Ban
- Cathie Wood’s Ark Invest Files for BTC, ETH, SOL, XRP, ADA Crypto Index ETF
- Solana Price Prediction as SOL ETF Inflows Outpace BTC and ETH Together
- Bitcoin and Gold Outlook 2026: Warsh, Rieder Gain Traction in Trump’s Fed Pick
- PEPE Coin Price Eyes 45% Rebound as Buyers Regain Control on Spot Markets
- Pi Network Price Prediction: Will PI Coin Hold Steady at $0.18 Retrace Lower?
- Dogecoin Price Prediction as 21Shares Announces DOGE ETF
- GME Stock Price Outlook as CEO Ryan Cohen Buys Shares Amid Store Closures


