Bitcoin Price Analysis: BTC/USD In Repeat Mode Until Breakdown To $7,200 After Testing $8,500


- Bitcoin price flirts with the 50-day EMA as a breakdown to $7,200 looms.
- BTC/USD price consolidation is set to continue before the breakdown based on the prevailing technical picture.
Bitcoin price is in a lull or rather a deep slumber where almost no action is taking place. However, when you take a closer look at the daily chart using the 50-day Exponential Moving Average (EMA), the price has been bouncing off the 50 EMA repeatedly. In this case, the moving average is the support that is being tested multiple times. In other words, the longer Bitcoin hits and bounces off the 50 EMA, the weaker the support becomes.
Related reading: Bitcoin Technical Analysis: How This Bollinger Band Constriction Could Catapult XBT/USD Past $10,000?
A contrary motion was witnessed in April where Bitcoin kept hitting on the 50 EMA but then it was it was resistance. This movement eventually weakened the resistance and Bitcoin pumped strongly upwards. The testing of the 50 EMA support is actually sending out a bearish signal. Once the moving average support is shattered, expect Bitcoin price to plummet to $7,200, however, $8,500 would be tested first.
BTC/USD daily chart
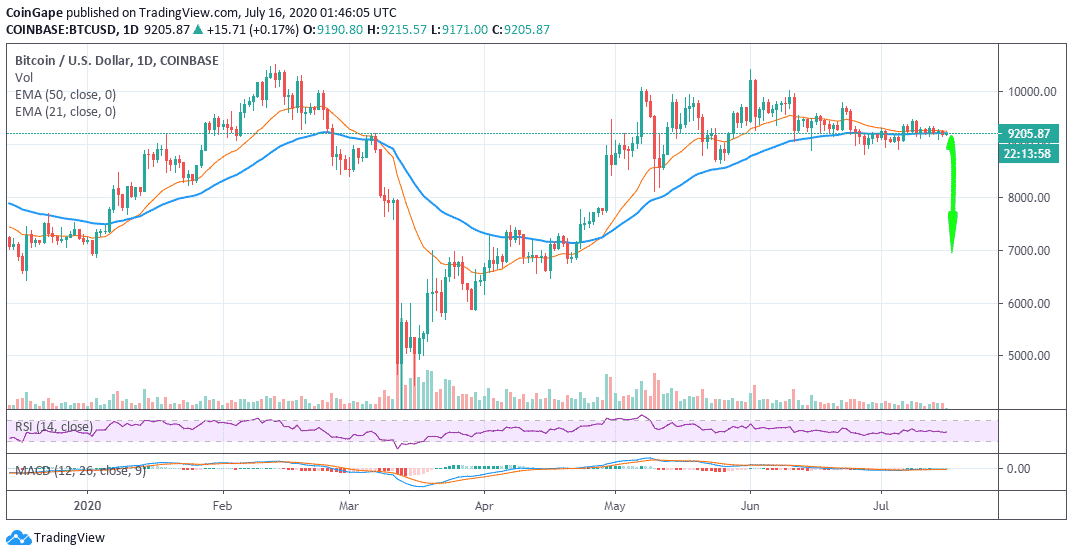
At the time of writing, Bitcoin is trading right at the 50 EMA. The largest crypto is likely to experience consolidation ahead of a drop, but note that at the moment the volume is ultra-low. Moreover, looking at other parameters such as the Relative Strength Index (RSI), we can tell that the drop will not be immediate. BTC/USD sideways trading action which is currently reinforced by the Moving Average Convergence Divergence (MACD) as it clings tightly to the midline, is set to hold for some time.
Read more: Bitcoin & Cryptocurrency FinTech Apps Outperform Non-Crypto Peers: Report
Support is also embraced at $9,200 and is likely to continue holding as it has done in the last 24 hours. Upward price action could continue to delay because most buyers have retreated to the sidelines in order to avoid the choppy markets. Therefore, the resistance at $9,250 and $9,300 could remain in place much longer.
Bitcoin Key Intraday Levels
Spot rate: $9,210
Relative change: 16.80
Percentage change: 0.18%
Volume: Low
Trend: Sideways trading bias

Why Trust CoinGape
CoinGape has covered the cryptocurrency industry since 2017, aiming to provide informative insights Read more… to our readers. Our journal analysts bring years of experience in market analysis and blockchain technology to ensure factual accuracy and balanced reporting. By following our Editorial Policy, our writers verify every source, fact-check each story, rely on reputable sources, and attribute quotes and media correctly. We also follow a rigorous Review Methodology when evaluating exchanges and tools. From emerging blockchain projects and coin launches to industry events and technical developments, we cover all facets of the digital asset space with unwavering commitment to timely, relevant information.
Delivered every day.
- Insights that move markets
- 100,000 active subscribers
Related Articles


- Bitcoin Crashes to $72k as U.S.–Iran Tensions Rise After Talks Collapse
- Bringing Compute Power to the Masses in a Sustainable, Decentralized Manner
- Bitcoin Reserve: U.S. Treasury Rules Out BTC Buys as GOP Senators Push For Use Of Gold Reserves
- Epstein Files: How Jeffrey Epstein Had Ties to Bitcoin and Crypto’s Early Development
- Crypto Market Continues to Plunge, Could 2026 Be the Worst Year?
- Dogecoin Price Prediction After SpaceX Dogecoin-Funded Mission Launch in 2027
- Solana Price Crashes Below $95 for the First Time Since 2024: How Low Will SOL Go Next?
- Ethereum Price Eyes a Rebound to $3,000 as Vitalik Buterin Issues a Warning on Layer-2s
- Pi Network Price Outlook as Bitcoin Faces a Strong Sell-Off Below $80k
- Bitcoin Price Prediction As US House Passes Government Funding Bill to End Shutdown
- Ondo Price Prediction as MetaMask Integrates 200+ Tokenized U.S. Stocks


