Bitcoin Price Analysis: BTC/USD Short Squeezed Under $6,800; Why Breakdown to $6,400 Is Imminent?
- Bitcoin price retreats from the weekly high close to $6,800, risks breaking down to $6,400 if $6,600 support caves in.
- BTC/USD faces short term overbought conditions at $6,800 resulting in a short squeeze as the price spirals towards $6,600.
Bitcoin has been relatively bullish since the trading started on Monday this week. A weekend low had been formed closer to the support at $5,800. The reversal on Monday saw the bulls retake the support above $6,200. More bullish action pushed BTC/USD above $6,400 but the price hit a wall at $6,500 early Wednesday.
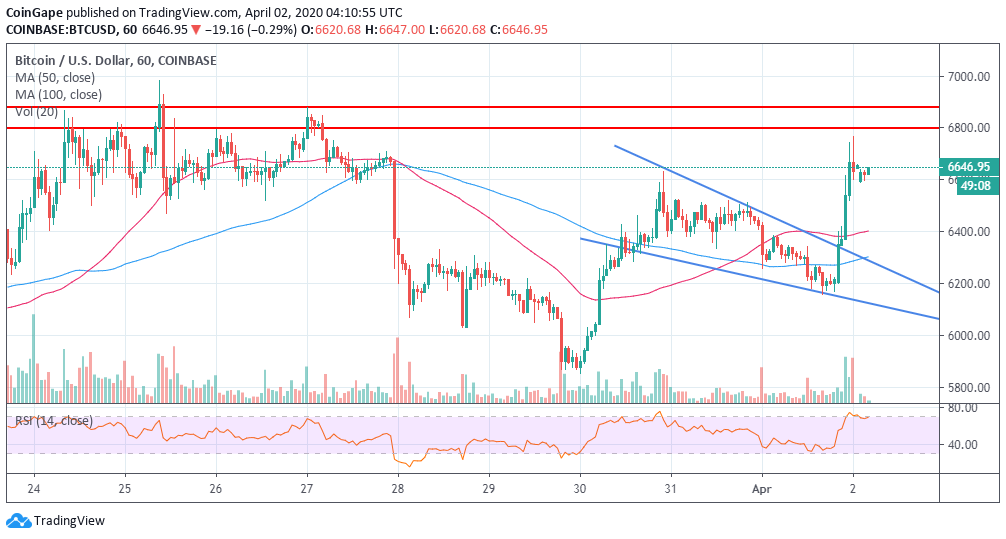
Observing Bitcoin in the hour range, I can spot a short term falling wedge pattern whose breakout culminated in a rally during the American session (on Wednesday). The price rallied towards $7,000 but lost steam within a whisker of $6,800. According to an analyst on Twitter, “BTC took a short 6,642… SL 6,830 retesting horizontal resistance. 1hr RSI overbought. 1hr Stock high and ready to come down. This is banking on all this being a Short Squeeze.”
Bitcoin price technical picture
The breakout to $6,800 was mainly technical; following BTC step above the falling wedge pattern, the 50 SMA in the 1-hour range and the 100 SMA. At the time of writing, Bitcoin is teetering at $6,607 following a retreat from the weekly high at $6,771. This short-lived rally was not fundamentally supported which explains the immediate reversal. If the support at $6,500 gives in, there is a chance that Bitcoin could breakdown further to test $6,400 (100 SMA) before finding balance.
BTC/USD 1-hour chart
Bitcoin Levels To Watch
Spot rate: $6,643
Relative change: -20
Percentage: -0.30%
RSI: Retreats from the overbought
Trend: Bearish
Recent Posts
- Crypto News
BOJ Hikes Interest Rates to 30-Year High, Will Bitcoin Repeat 20-30% Post-Hike Crashes?
The Bank of Japan (BOJ) raises its interest rates by 25 bps to 0.75%, the…
- Crypto News
Breaking: U.S. Senate Delays CLARITY Act again, Crypto Market Structure Vote Slips to Early 2026
The CLARITY Act is no longer expected to pass the U.S. Senate this year. Lawmakers…
- Crypto News
Breaking: Bitwise Files S-1 For SUI ETF With U.S. SEC
Crypto ETF issuer Bitwise is looking to add a SUI ETF to its growing list…
- Crypto News
Crypto Hacks 2025: North Korean Hackers Steal over $2B in ETH and SOL This Year
In 2025, crypto hacks increased significantly. The cybercriminals associated with the North Korean government stole…
- Crypto News
Universal Exchange Bitget Removes Barriers to Traditional Markets, Offers Forex and Gold Trading to Crypto Users
The number one universal exchange Bitget is removing barriers between crypto and traditional finance. It…
- Crypto News
Breaking: U.S. CPI Inflation Falls To 2.7% YoY, Bitcoin Price Climbs
The U.S. CPI inflation came in well below expectations, providing a bullish outlook for Bitcoin…