Bitcoin Price May Dip To $28.5k; Here’s How To Trade Week Ahead


The leading cryptocurrency, Bitcoin is hovering above $30,000 following a brief dip to $29,592 on Monday. Ripple’s partial win in the SEC lawsuit was positive for the crypto market in general, but failed to trigger interest across the market, culminating in Bitcoin giving back the gains above $31,000.
Analysts and industry experts are attributing Bitcoin’s failed movement above $30,000 to various factors, including a sudden interest in XRP and tokens the SEC deemed securities in early June, including Cardano (ADA), Solana (SOL), and Polygon (MATIC).
A Slump In Investor Interest Means A Slippery Road Ahead
According to CryptoQuant on-chain analyst Crazzyblockk, the short-term holder (STH) realized price (less than 6 months) has witnessed a considerable drop in accumulations interest among new investors. This cohort says in the market between one and three months.
Furthermore, the Bitcoin price recovery is likely depressed by both the short-term and long-term (3 – 6 months) realizes prices, which hold at $27,200 and $25,800. If combined, the realized prices average around $28,500.
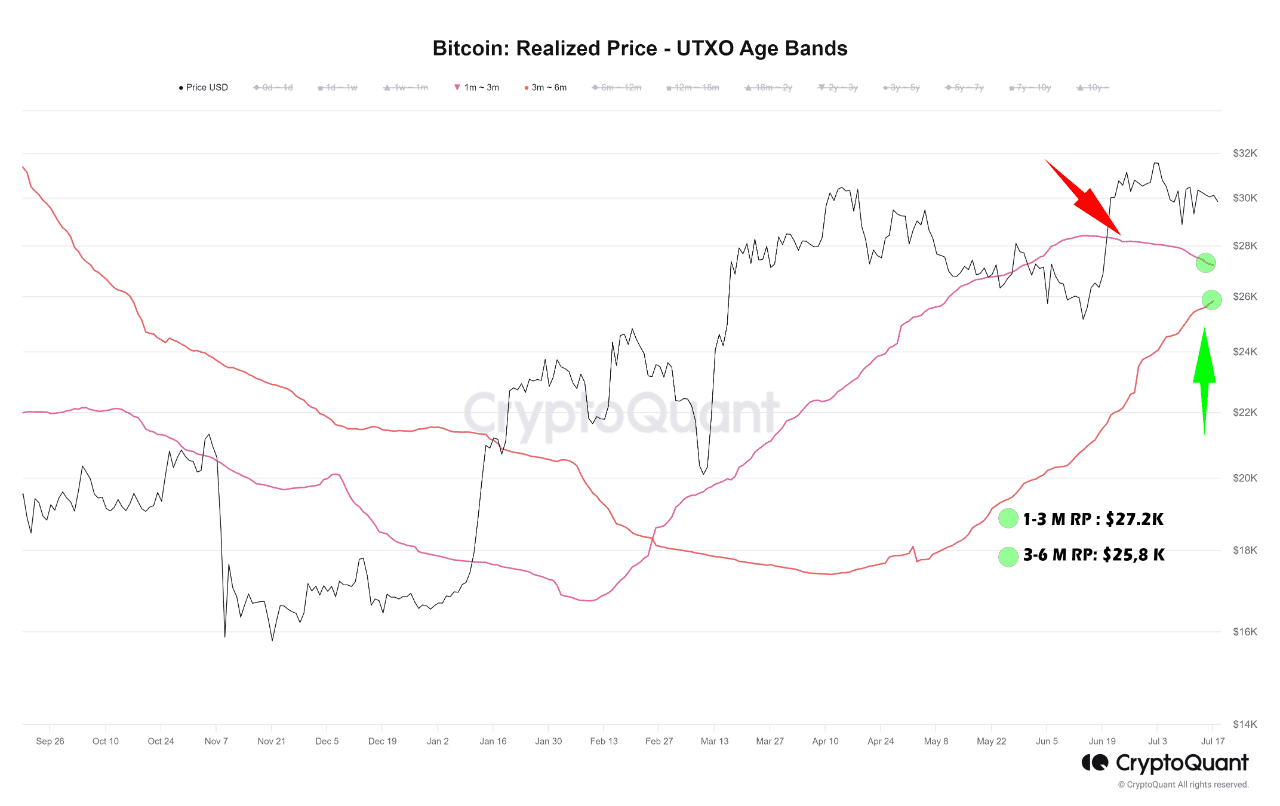
As of July 18, both bands had recorded impressive gains, with profits standing at 9.5% and 15.5% respectively. Nonetheless, in the event of a price correction, it is plausible that these holders may experience a certain degree of selling pressure.
Notably, any strong signs of selling pressure below $30,000 could trigger panic among investors who are betting on Bitcoin price to rally to $35,000 and $38,000. That said, it is still premature to rule out declines to $28,000 and $25,000, especially with BTC hovering at $30,000.
BTC Chart Analysis: When Is Bitcoin Price Likely To Breakout?
The largest cryptocurrency has remained unchanged in 24 hours and trading at $30,102 on Tuesday as investors bid farewell to the Asian session ahead of the European session. Bitcoin has a market cap worth $584 billion, with $14 billion of trading volume coming in.
Based on the daily chart, Bitcoin price is not far from a rectangle pattern breakout but Jake Boyle, the CCO at Caleb & Brown, an Australian crypto exchange, the ongoing stagnation may last longer with minor up-downs until the market encounters some key events.
The daily chart shows BTC holding the bullish rectangle support, from which a breakout may trigger a 10% move from $30,000 to $33,000. For this breakout to come into play, bulls must defend the support at $30,000 and push for sustained price movement above $31,500, representing the rectangle resistance.
Traders eyeing exposure to new BTC longs may want to wait for confirmation from volume indicators like the Money Flow Index (RSI) and the On-Balance-Volume (OBV).
As the MFI climbs above the midline and toward the overbought region, it shows that investors’ risk appetite for BTC is growing—and subsequently building momentum behind the world’s most prominent crypto asset.
Although Bitcoin is still finding the right path out of the woods, the situation is not that dire, especially with the Stochastic indicators sending a bullish signal. Longs traders can sit tight as long as the oscillator is reversing the trend from the oversold region.
Related Articles
- Breaking: Presidential Candidate RFK Jr. Plans To Back US Dollar With Bitcoin & End Taxes
- S2F Creator Predicts $500K Price for Bitcoin in Next Halving
- Breaking: Bankrupt Celsius Reaches Settlement To Pay $24 Million Over GK8 Sale

Why Trust CoinGape
CoinGape has covered the cryptocurrency industry since 2017, aiming to provide informative insights Read more… to our readers. Our journal analysts bring years of experience in market analysis and blockchain technology to ensure factual accuracy and balanced reporting. By following our Editorial Policy, our writers verify every source, fact-check each story, rely on reputable sources, and attribute quotes and media correctly. We also follow a rigorous Review Methodology when evaluating exchanges and tools. From emerging blockchain projects and coin launches to industry events and technical developments, we cover all facets of the digital asset space with unwavering commitment to timely, relevant information.

Delivered every day.
- Insights that move markets
- 100,000 active subscribers
Related Articles


- Brian Armstrong Offloads $101M in Coinbase Stock Amid COIN’s Steep Decline
- MSTR Stock in Focus After CEO Phong Le Signals More BTC Buys
- Cardano Founder Sets March Launch for Midnight as Expert Predicts BTC Shift to Privacy Coins
- U.S. Government Shutdown Odds Hit 84%, Will Bitcoin Crash Again?
- Wall Street Giant Citi Shifts Fed Rate Cut Forecast To April After Strong U.S. Jobs Report
- Ethereum Price at Risk of a 30% Crash as Futures Open Interest Dive During the Crypto Winter
- Ethereum Price Prediction Ahead of Roadmap Upgrades and Hegota Launch
- BTC Price Prediction Ahead of US Jobs Report, CPI Data and U.S. Government Shutdown
- Ripple Price Prediction As Goldman Sachs Discloses Crypto Exposure Including XRP
- Bitcoin Price Analysis Ahead of US NFP Data, Inflation Report, White House Crypto Summit
- Ethereum Price Outlook As Vitalik Dumps ETH While Wall Street Accumulates


