Bitcoin Price Prediction: BTC Uptrend Shatters As Declines To $30,000 Beckon
- Bitcoin price pulls the entire market down as support at $33,000 is tested.
- BTC’s short-term technical indicators flash sell signal as losses gain momentum.
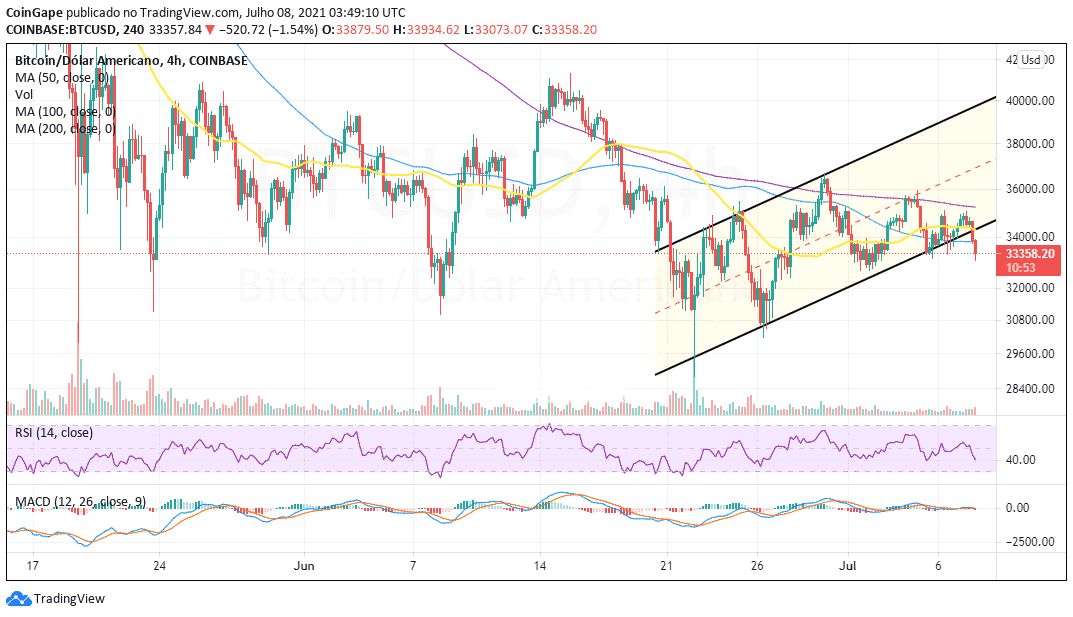
Bitcoin price seems to have abandoned the uptrend toward $40,000 due to the resistance at $35,000. Over the last two weeks, BTC’s price action within the confines of an ascending parallel pattern.
In addition to the 200 Simple Moving Average (SMA) resistance, selling orders soared amid the bullish camp’s exhaustion. At the time of writing, support at $34,000 has been lost, giving Bitcoin leeway to explore the rabbit hole to $33,000.
Bitcoin price declines to $30,000 linger
Bitcoin Price Analysis: BTC/USD four-hour chart
Support at $33,000 remains critical to the resumption of the uptrend. However, if broken, traders should prepare for the correction to continue. The Relative Strength Index (RSI) has dipped below the midline and is closing in on the oversold region, adding credence to the bullish outlook.
Read More: U.S. Senators And Their Bitcoin or Crypto Purchases, The Game Gets Real
The Moving Average Convergence Divergence (MACD) indicator has also presented a sell signal in the same four-hour timeframe. This indicator follows the trend of an asset and calculates its momentum. In turn, the MACD sends out bullish and negative signals.
Following the MACD line (blue) crossing beneath the signal line, a call to sell appeared. The MACD dip will reinforce this bearish outlook under the mean line (blue) into the negative region.
Note that bulls hope to secure the support at $33,000, but if they fail to, the next anchor is expected at $32,000, which may avert the bearish leg from extending to $30,000.
Bitcoin price intraday levels
- Spot rate: $33,350
- Trend: Bearish
- Volatility: Expanding
- Support: $33,000 and $32,000
- Resistance: $34,000 and $36,000
Recent Posts
- Crypto News
BlackRock Bitcoin ETF Ranks Among Top ETFs In 2025 Despite Crypto Downturn
The BlackRock Bitcoin ETF (IBIT) has emerged as one of the top exchange-traded funds (ETF)…
- Crypto News
Stablecoin Adoption Deepens as Klarna Turns to Coinbase for Institutional Liquidity
Klarna has taken a major step into crypto finance by partnering with Coinbase to accept…
- Crypto News
Ripple, Circle Could Gain Fed Access as Board Seeks Feedback on ‘Skinny Master Account’
The U.S. Federal Reserve has requested public feedback on the payment accounts, also known as…
- Crypto News
Fed’s Williams Says No Urgency to Cut Rates Further as Crypto Traders Bet Against January Cut
New York Federal Reserve President John Williams has signaled his support for holding rates steady…
- Crypto News
Trump to Interview BlackRock’s Rick Rieder as Fed Chair Shortlist Narrows to Four
The Fed chair race is heating up with U.S. President Donald Trump set to interview…
- Crypto News
Breaking: VanEck Discloses Fees and Staking Details for its Avalanche ETF
The leading crypto asset manager VanEck amends its Avalanche ETF with the U.S. Securities and…