Bitcoin Technical Analysis: How This Bollinger Band Constriction Could Catapult XBT/USD Past $10,000?


- Bitcoin price is likely to cling to the sideways trading action until a breakout occurs following the Bollinger Band constriction.
- XBT/USD currently holds above the 50-day SMA as well as the Bollinger Band middle curve.
Bitcoin/US dollar perpetual inverse swap contract is dealing with low volatility in the same way as the usual BTC/USD trading pair. Motionless trading has continued to dominate the market for a few weeks now. While support is well embraced above $9,000, recovery is limited with gains becoming unsustainable above $9,300.
Related content: Bitcoin Price Rally To $9,600 Still Imminent As Hash Rate Hits New All-time High In July
At the time of writing, Bitcoin is trading at $9,250 with its immediate downside supported by a confluence formed by both the RSI and the Bollinger Band daily curve. On the upside, the Bollinger Band upper curve is limiting the bulls’ efforts.
The Bollinger Band constriction is at the tightest level since the beginning of the year. In other words, XBT/USD is confined in the narrowest range. The trading is happening in a tight range amid the lowest volatility. Consequently, this could be the right time to buy Bitcoin in anticipation of a rally following a breakout from the tight range.
A wider scope shows that Bitcoin’s technical picture could remain unchanged in the coming sessions. The Relative Strength Index (RSI) is also motionless at the midline. In addition, the Moving Average Convergence Divergence (MACD) is moving sidelong at the mean line.
Read also: Bitcoin [BTC] P2P Volume in Africa and S. America Reaching New ATHs in 2020, Report
XBT/USD daily chart
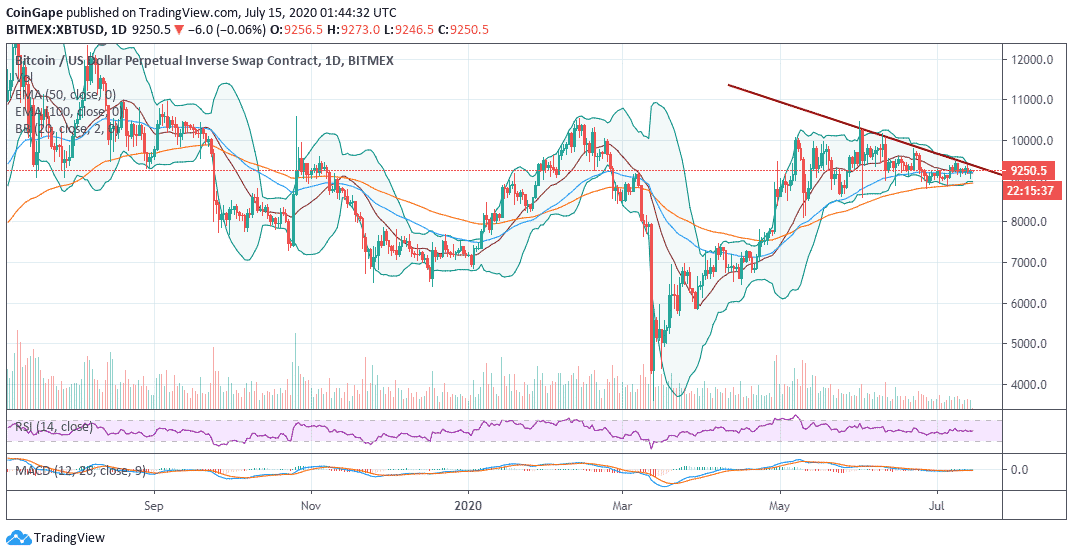
For now, sideways trading will take precedence. However, traders must trade with the anticipated rally in mind. Following the breakout, the journey past $10,000 is likely to be a quick and smooth one. Trading above the descending trendline resistance would confirm the breakout. Bulls will also have to follow up with increased buying entries to create the right volume to support a rally.
Bitcoin Key Intraday Levels
Spot rate: $9,250
Relative change: -6
Percentage change: -0.06%
Trend: Sideways trading bias
Volatility: Low

Why Trust CoinGape
CoinGape has covered the cryptocurrency industry since 2017, aiming to provide informative insights Read more… to our readers. Our journal analysts bring years of experience in market analysis and blockchain technology to ensure factual accuracy and balanced reporting. By following our Editorial Policy, our writers verify every source, fact-check each story, rely on reputable sources, and attribute quotes and media correctly. We also follow a rigorous Review Methodology when evaluating exchanges and tools. From emerging blockchain projects and coin launches to industry events and technical developments, we cover all facets of the digital asset space with unwavering commitment to timely, relevant information.
Delivered every day.
- Insights that move markets
- 100,000 active subscribers
Related Articles


- Trump’s World Liberty Faces House Probe Amid Claims of Major UAE Investment
- Bitmine ETH Position Bleeds Billions As Ethereum Struggles to Hold $2k
- Crypto Market Crash Deepens as Bitcoin Falls to $70K amid Bear Market Jitters
- CLARITY Act: Crypto Firms Propose New Changes to Advance Stalled Market Bill
- Binance Denies Fake Cease-and-Desist Claim Amid Bankruptcy Rumors
- Dogecoin Price Prediction After SpaceX Dogecoin-Funded Mission Launch in 2027
- Solana Price Crashes Below $95 for the First Time Since 2024: How Low Will SOL Go Next?
- Ethereum Price Eyes a Rebound to $3,000 as Vitalik Buterin Issues a Warning on Layer-2s
- Pi Network Price Outlook as Bitcoin Faces a Strong Sell-Off Below $80k
- Bitcoin Price Prediction As US House Passes Government Funding Bill to End Shutdown
- Ondo Price Prediction as MetaMask Integrates 200+ Tokenized U.S. Stocks


