Bitcoin Technical Analysis: XBT/USD Fake Breakout Sabotages Rally To $10,000


- Bitcoin/US dollar perpetual inverse swap contract falls back to $9,200 support after hitting a wall under $9,500.
- XBT/USD is clinging to the 50-day EMA support in a bid to prevent possible declines under $9,000.
Bitcoin/US dollar perpetual inverse swap contract has resumed the downtrend following a rejection from levels close to $9,500. A short-lived rally broke out above a symmetrical triangle pattern but it did not hold water.
The reversal underway is testing the strength of the initial support at $9,200. Moreover, the immediate downside is supported by the 50-day Exponential Moving Average (EMA). The retreat has already pushed the price back within the apex of the symmetrical triangle pattern.
Read more: Bitcoin Price Analysis: Why BTC/USD Breakdown To $8,000 Is Around The Corner?
XBT/USD daily chart
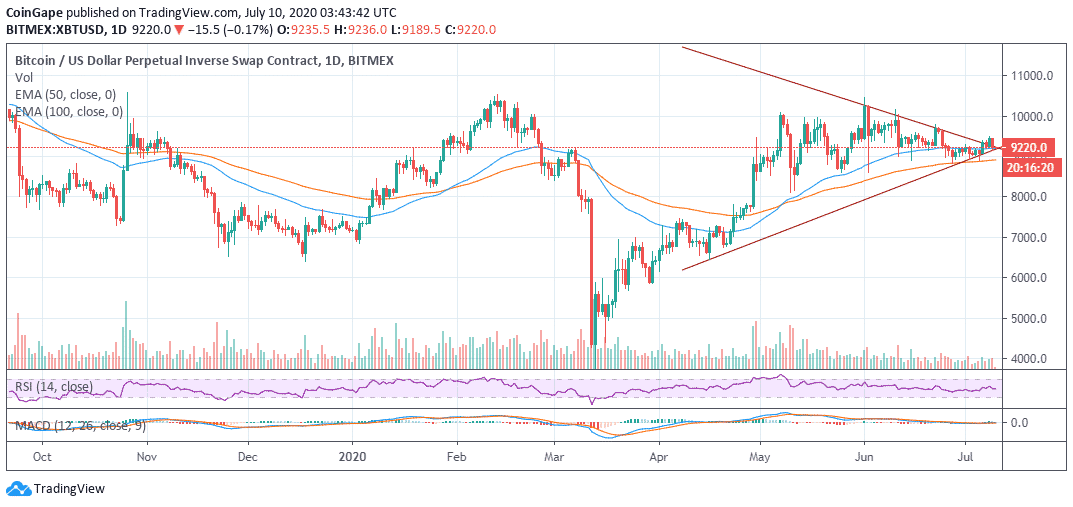
It is important that bulls are aware of the possible dire declines if the XBT/USD slide under the triangle support. First, the support at $9,000 would be in jeopardy. Second, more sellers could enter the market and push the price towards $8,000 in order to create opportunities for buying the dip.
Meanwhile, there is a possibility that XBT/USD would contain the losses above $9,200 in favor of a consolidative movement. Consolidation would also allow the bulls to find balance, increase their entries in anticipation of a rally towards $10,000.
Related content: Bitcoin Price Analysis: BTC/USD Begins To Make The Vital Steps To $10,000
Technically, sideways trading is the dominant trend likely to take precedence in the coming sessions. A glance at the RSI shows that sellers have a slightly upper hand but the gradual movement of the RSI hints that Bitcoin could settle for horizontal price action. Also putting emphasis on the ranging motion is the MACD at 0.00 (midline). A break into the positive region would pave the way for gains above $9,400. However, a return of the MACD into the negative zone could see selling positions increased and XBT spiraling under $9,000.
XBT/USD Intraday Key Levels
Spot rate: $9,921
Percentage change: -0.17
Relative change: -14
Trend: Bearish
Volatility: Expanding

Why Trust CoinGape
CoinGape has covered the cryptocurrency industry since 2017, aiming to provide informative insights Read more… to our readers. Our journal analysts bring years of experience in market analysis and blockchain technology to ensure factual accuracy and balanced reporting. By following our Editorial Policy, our writers verify every source, fact-check each story, rely on reputable sources, and attribute quotes and media correctly. We also follow a rigorous Review Methodology when evaluating exchanges and tools. From emerging blockchain projects and coin launches to industry events and technical developments, we cover all facets of the digital asset space with unwavering commitment to timely, relevant information.
Delivered every day.
- Insights that move markets
- 100,000 active subscribers
Related Articles


- Is Bhutan Selling Bitcoin? Government Sparks Sell-Off Concerns as BTC Crashes
- ‘XRP Treasury’ VivoPower Abandons Crypto Strategy Amid Market Crash, Stock Price Dumps
- Bitcoin Crashes to $65K as Crypto Market Erases $2T in Market Cap Since October Record High
- Trump’s World Liberty Financial Dumps Bitcoin as BTC Falls Back to 2021 ATH
- CLARITY Act Markup Still On Course as Senate Puts Crypto Bill on Schedule, Lummis Assures
- Dogecoin, Shiba Inu, and Pepe Coin Price Prediction as Bitcoin Crashes Below $70K.
- BTC and XRP Price Prediction As Treasury Secretary Bessent Warns “US Won’t Bail Out Bitcoin”
- Ethereum Price Prediction As Vitalik Continues to Dump More ETH Amid Crypto Crash
- Why XRP Price Struggles With Recovery?
- Dogecoin Price Prediction After SpaceX Dogecoin-Funded Mission Launch in 2027
- Solana Price Crashes Below $95 for the First Time Since 2024: How Low Will SOL Go Next?


