BNB Price Prediction: Potential Buy the DIP Signal for BNB Coin As Bullish Divergence Forms on Intraday Levels


The Binance Coin (BNB) ranks at the number three crypto project by market cap after Ethereum’s ETH and recently tops the list of Smart contract platforms and cryptocurrency exchanges with price growth of about 170% after recovering from the crypto market-wide price slump on 17 May ’21.
Fibonacci projections on the 01 May ’21 high low range on the monthly time frame overview of the BNBUSDT show that the crypto pair could skyrocket beyond the 1000 USD round-number resistance in the coming weeks of Q4 ’21.
The crypto exchange ranks at the number one position among native tokens of crypto exchange platforms such as the KCS and FTX.
TokenInsight ratings for the Binance BNB Coin is at a “BBB-rating”, a stable outlook for the centralized crypto exchange, which has continued to sustain a high team, project, and ecosystem score since the start of the year.
Let’s further analyze the BNBBTC and BTCUSDT price charts for chart patterns and trend insights.
BNB Price Prediction: BNBBTC Weekly Chart
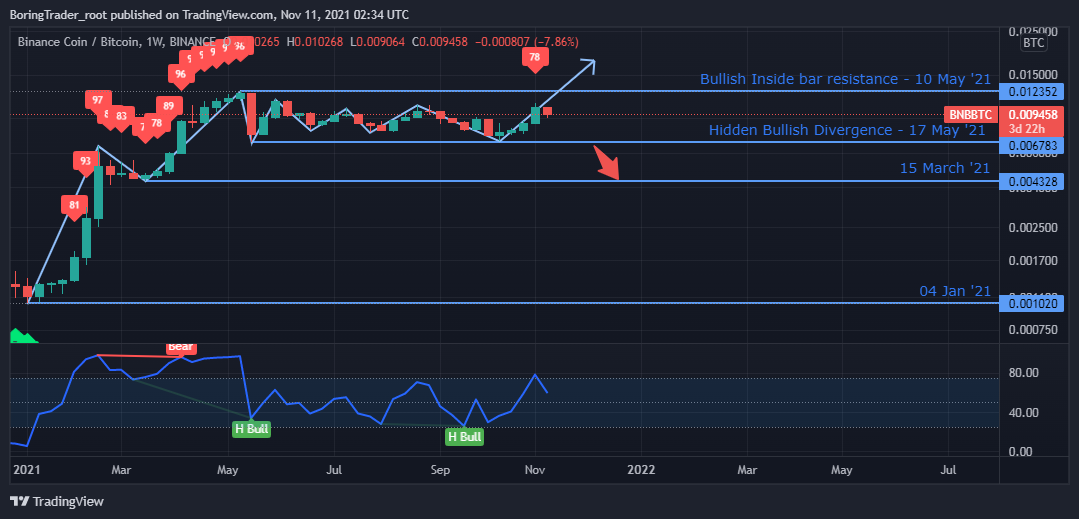
After trading within a sideways market structure since 17 May, the Binance BNB Coin slowly sees growing demands against Bitcoin in the last four weeks.
Hidden bullish divergence patterns kept the relative strength index above level-25 confirming an extended upbeat campaign.
BNB Price Prediction: BNBUSDT Weekly Chart
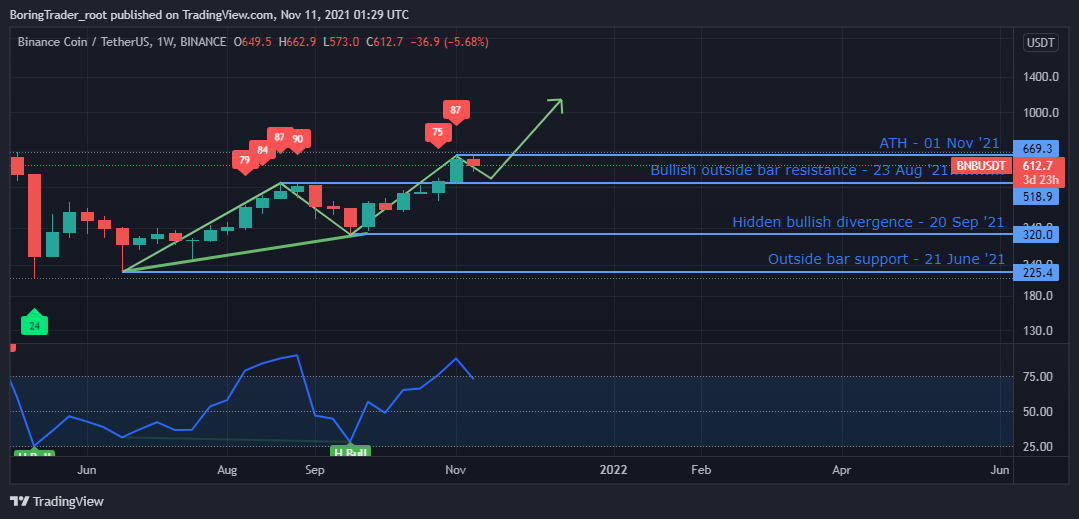
Following a similar path as the monthly time frame, the weekly chart overhead shows the BNBUSDT in an established uptrend with hidden bullish divergence and higher RSI values above level-25.
The recent price correction we see this week could likely find support on the 23 August ’21 old resistance now turned support [$518.90], and setting up a rubber-band effect for a bullish price trajectory.
BNB Price Prediction: BNBUSDT Daily Chart
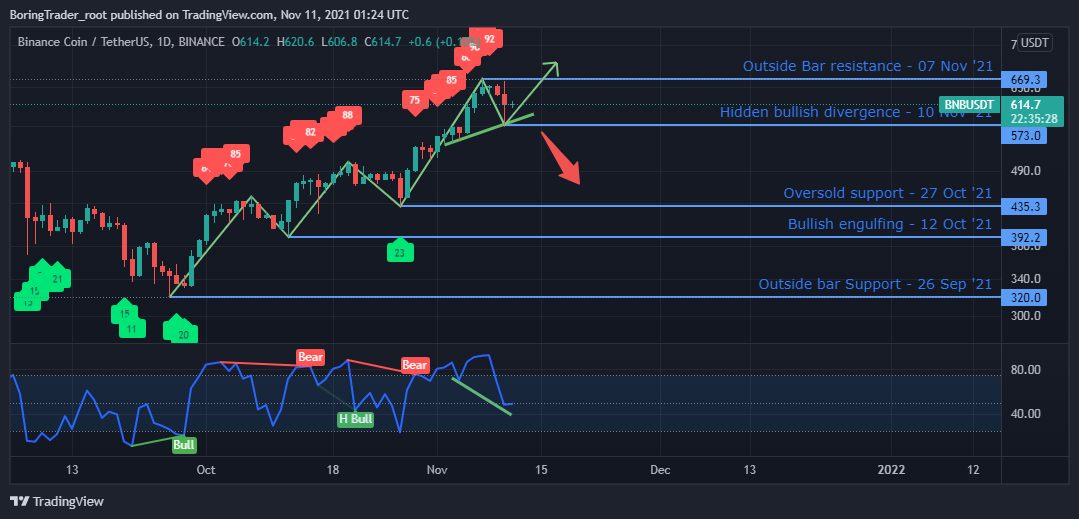
The bulls show their presence by propping up the BNB price at $573.00 after a price slump from the $689.30 resistance.
If the hidden bullish divergence pattern at press time holds the support level, we may see the price rising beyond the current ATH.
However, a price slump below the $573.00 would simply mean that the BNBUSDT may be looking to find a price floor within the RSI oversold area.
BNB Price Prediction: BNBUSDT 4 Hr Chart
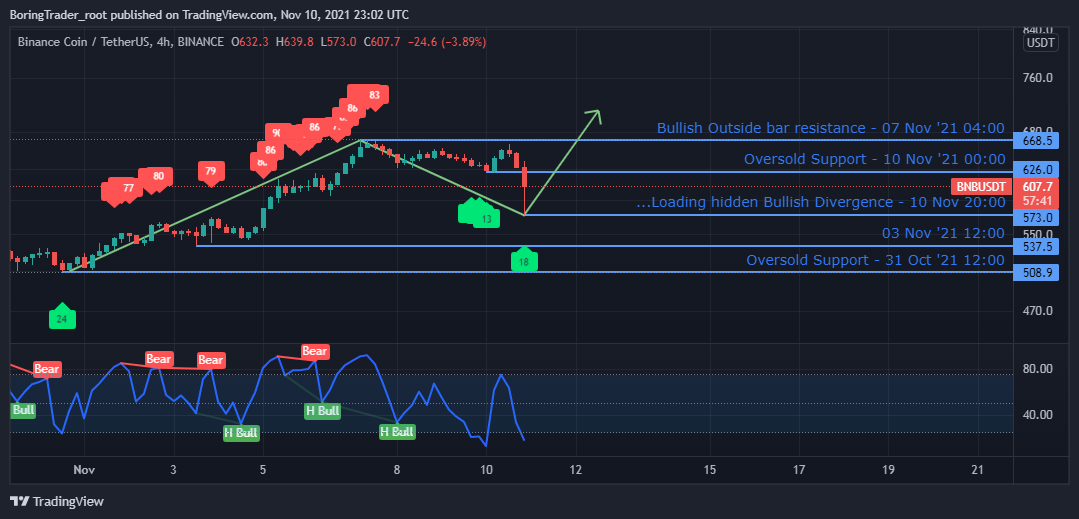
The intraday 4HR time frame above signals a regular bullish divergence after a price breakdown to the $573.00 support. We expect a rise in buying power towards the BNB Coin from the 10 November 20:00 bullish divergence setup.

Why Trust CoinGape
CoinGape has covered the cryptocurrency industry since 2017, aiming to provide informative insights Read more… to our readers. Our journal analysts bring years of experience in market analysis and blockchain technology to ensure factual accuracy and balanced reporting. By following our Editorial Policy, our writers verify every source, fact-check each story, rely on reputable sources, and attribute quotes and media correctly. We also follow a rigorous Review Methodology when evaluating exchanges and tools. From emerging blockchain projects and coin launches to industry events and technical developments, we cover all facets of the digital asset space with unwavering commitment to timely, relevant information.

Delivered every day.
- Insights that move markets
- 100,000 active subscribers