10 Crypto Chart Patterns to Elevate Your Trading

Crypto chart patterns, frequently combined with candlestick trading, provide a visual story of how prices have behaved in the markets and often indicate a bullish, bearish, or neutral emotion. Over time, a bullish market suggests that the price trend will continue to rise, whereas an adverse market indicates the reverse. This post will introduce some crypto chart patterns that are useful while trading and help you read them.
1. Head and Shoulder Pattern
Head and Shoulders crypto patterns are employed in technical analysis to find the peaks. A baseline with three peaks represents the pattern, the central peak being the tallest and the outside two being near in height. The Head and Shoulders pattern is formed when cryptocurrency prices peak and fall back to the beginning of the previous uptrend.
The price creates the “head” by rising above the previous high and returning to the base. At last, the cost of cryptocurrency reaches a new peak at the level of the formation’s first peak before declining once again. You can use automated tools on charting software to discover this pattern in your crypto graph analysis.
Head and Shoulders pattern is among the most trustworthy patterns for trend reversals on a crypto cycle chart. It is one of numerous top patterns that indicate the conclusion of an upward trend, with varied degrees of accuracy.
The most typical entry point is a breakout of the neckline, stopping either above the right shoulder (market top) or below it (market bottom). The profit target is the difference between the breakout price and the low and high points to which the pattern has been added (market bottom) or subtracted (market top).
This approach is not flawless, but it does give a means of trading the markets based on rational price fluctuations. H&S is one of the best crypto chart indicators that help you make informed decisions.
2. Falling Wedge Pattern
One of the bullish crypto chart patterns known as the Falling Wedge expands at the peak and contracts as prices descend. As the response highs and reaction lows converge, the price action creates a cone with a downward slope. A Falling Wedge can be classified as a continuation crypto pattern even if it is a reversal pattern. This pattern continues to slope downward, but it will do so at an angle to the general upswing.
The falling wedge reversal pattern slopes downward and in line with the general trend. Falling wedge formations are considered bullish regardless of whether they are reversal or continuation patterns in the best chances of crypto charts.
3. Rising Wedge Pattern
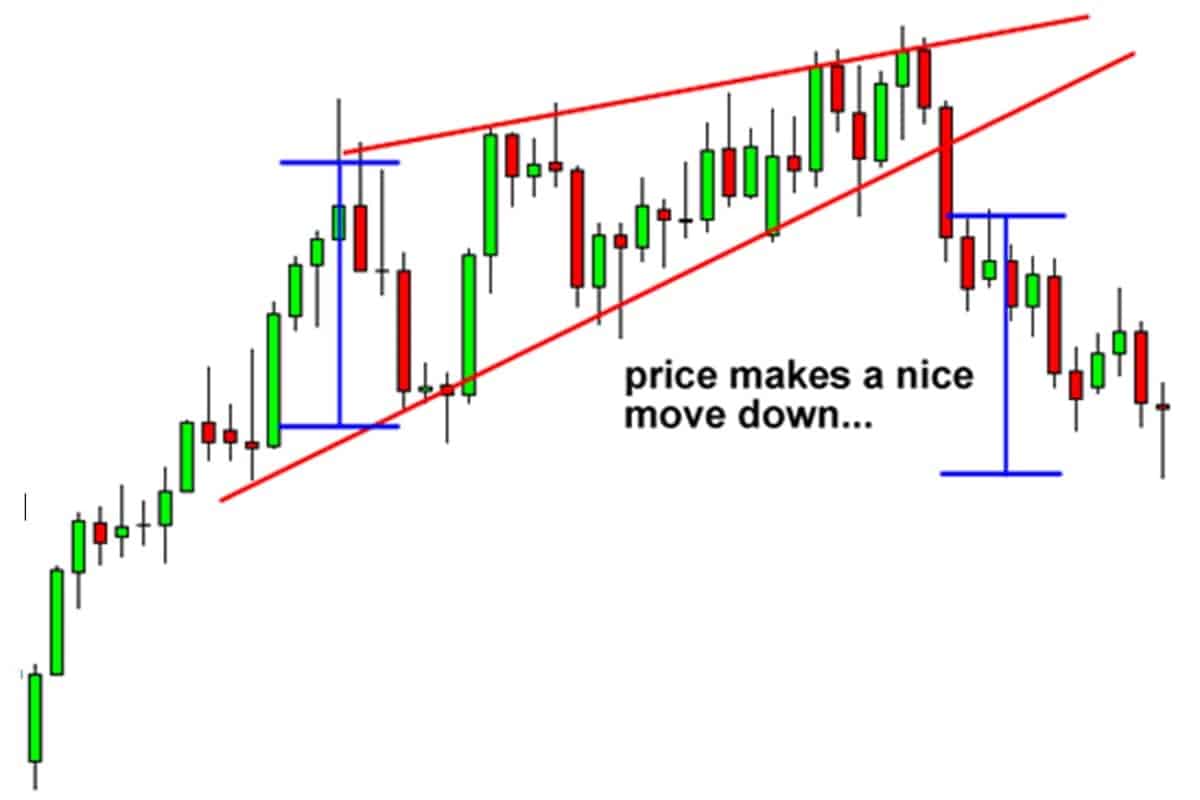
A bearish pattern of the crypto cycle chart known as the Rising Wedge expands from the bottom and compresses as prices rise and the trading range gets smaller. Rising wedges slope upward and have a negative bias, unlike symmetrical triangles, which lack a clear slope and a bullish or bearish bias.
On the other hand, a Rising Wedge pattern might also fall under the continuation heading on cryptocurrency charts. The rising wedge pattern will continue to slope upward, but it will do so at an angle to the general downturn. The increasing wedge will tilt upward and align with the current trend as a reversal pattern. Rising wedges are bearish regardless of their kind (reversal or continuation).
4. Flag Pattern
When the price of an asset or stock rises quickly over a brief period, it forms a flag pattern known as the flagpole. Flag crypto patterns belong to the continuing crypto chart patterns and are temporary stops in a moving market. Before the previous trend continues, a consolidation pattern in a rectangle shape will appear.
In technical analysis, a flag pattern usually develops following a significant price move in a specific direction. The pattern is seen as the market taking a break or rest before continuing in the same direction.
Two primary categories of flag chart patterns are bearish and bullish. A bearish flag pattern on a crypto cycle chart indicates a downturn continues, whereas a bullish flag pattern suggests an upswing. It slopes upward following a downturn and downward following an uptick. The creation of patterns depends on the previous trend.
Finding a breakthrough above or below the flag pattern is the key to trading flag patterns. The upper limit of the breakout above is regarded as a buy signal, and the lower border below is seen as a sell indication. The flag pattern is a customizable trading pattern that helps you change the best crypto charts according to your prospect and attitude.
5. Double Top and Bottom Pattern
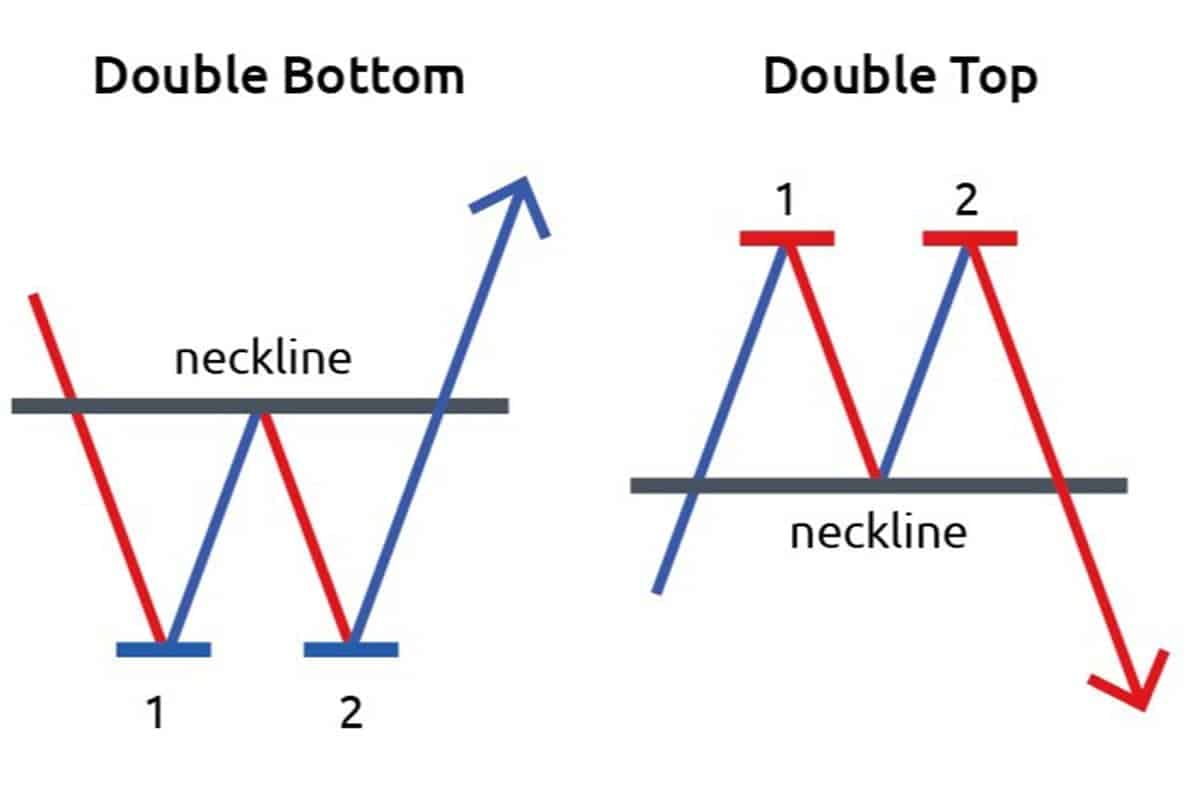
A double-top pattern is a bearish reversal pattern that forms following an upswing movement on cryptocurrency charts. Two peaks rise over the neckline, or a support level, to produce the double top pattern. Following a robust rise, the initial peak forms and retraces to the neckline. The price turns bullish and rises again to build the second high after returning to its neckline. When the prices move back to the neckline following the creation of the second peak, the pattern is said to be complete.
The bearish trend reversal is confirmed when the prices breach the support level or the neckline. This pattern is one of the most comprehensive crypto graph analysis methods because of its accuracy and reliability.
Following a downward trend, bullish reversal crypto patterns known as double-bottom patterns develop on the crypto cycle chart. Two lows below the pattern’s resistance level—called the neckline—form this pattern. Following a significant downturn, the initial low is made, and the prices are then retraced to the neckline. The price turns bearish after making a second bottom by dropping one more to its neckline.
When the prices return to the neckline following the development of the second low, the pattern is said to be complete. Traders can initiate a long position whenever the prices confirm the bullish trend reversal and break past the resistance level or neckline. Of course, comparing different timeframes to find the best crypto charts and making the right decision for your trade is advised.
6. Tripple Top and Bottom
A reversal chart pattern known as the triple top pattern is created when a security’s price reaches the same resistance level three times before collapsing. The triple full pattern indicates a change in market mood from bullish to negative, which is seen as a bearish indication.
The price rises, tests a resistance level, retreats, and then rises again to push the barrier, completing the first two tops of the triple top pattern. The price pulls back once more before attempting to break through the level one last time after failing to break past the obstacle twice. But once more, if it is rejected, the triple top pattern is completed when the price drops below the support level.
The three peaks are separated by a considerable amount of time and have about equal heights. There is a span of several weeks to many months between the peaks. Usually, the volume pattern gets smaller as it goes up. As the tops develop, the volume decreases, indicating weakening purchasing pressure. Volume increases as sellers seize the initiative and push the price below support following the third high.
The breakdown of support suggests a decline in demand and a shift in mood from optimistic to pessimistic. The market has shifted in favor of sellers, and new purchasers are immediately overpowered by demand to buy. This increased supply lowers the price. The pattern is validated, and the breach of support confirms the downtrend of the crypto cycle chart. The triple top will make a lot of money if you study it entirely and conduct a thorough crypto graph analysis.
7. Ascending Triangle Pattern
Ascending triangles are produced by price movements that make it possible to form a rising trendline along the swing lows and a horizontal line along the swing highs. The two lines form a triangle on cryptocurrency charts. Traders frequently see triangle pattern breakouts. Either the upside or the downside may see the breakthrough.
Since the price will usually break out in the same direction as the trend that was in place just before the triangle formed, escalating triangles are sometimes referred to as continuation crypto chart patterns. An ascending triangle can be traded because it offers a distinct entry point, profit goal, and stop-loss level.
Ascending triangles are typically seen as continuation crypto patterns, essential in an upswing or a recession. Traders often purchase or sell the asset aggressively once the triangle breaks, depending on how the price moves and how they read crypto charts.
8. Up and Down Channel Pattern
To depict a downward trend, a descending channel is created by joining the lower highs and lower lows of the price of an asset with parallel trendlines on cryptocurrency charts. The descending channel, which is included in the general category of trend channels, is defined as the area between the trendlines. In general, technical traders employ channels extensively to recognize and track the patterns of securities over time.
A falling channel is a charting pattern technical analysts use to assess a security’s trend. Trendlines plotted at the support and resistance levels in a security’s price series are used to create a channel. Channels may be utilized to determine the best levels of support and resistance to purchase or sell stocks.
When two parallel lines cross each other’s peaks (upper line) and bottoms (lower line) and go up to the right, it is possible to identify the Channel Up crypto patterns. First, the trendline is defined by the bottom line, which is found to run along the lows. The top line, also known as the channel line, crosses the first notable peak and is found to be parallel to the trendline. Prices should bounce off both the top and lower bounds of the channel; the more times these reversals happen, the more consistent the pattern is.
Breakouts from the Channel Up have opposite meanings and can happen uphill and downward. When the price breaches the trendline, it may signify a significant, perhaps drastic, shift. On the other hand, breaking over the channel line indicates that the current trend of the crypto cycle chart is accelerating. However, remember that channels, like all different patterns, may occasionally experience false or premature breakouts, meaning that price may retreat inside the channel.
9. Rectangle Pattern
Rectangle crypto chart patterns help spot possible market prices. This pattern appears on a price chart as a rectangle when a security price moves for a long time within a horizontal range. In this time frame, the price drifts sideways inside a specific price range rather than trending in either direction. Rectangles are highly valued in crypto graph analysis methods because there are fewer risks in trading with them.
Price breakouts from the rectangle pattern on significant volume indicate a validated pattern. A breakout higher means an optimistic market. A downward break suggests a pessimistic outlook. Traders can find possible buy and sell signals using the rectangle chart pattern.
It is a buy signal when the price breaks out of the rectangle pattern to the upside and suggests an uptrend. When the price breaks out of the rectangle pattern and moves down, it may be in a downtrend, which triggers a sell signal.
10. Breakout and Retest Pattern
There are two essential components to the Break and Retest strategy: Break and Retest. The occurrence of both is necessary for the plan to demonstrate its sustainability. When an asset’s price reaches a high in momentum and breaks through a level of support or resistance, the mechanism starts to move. There is a lot of trading activity during the event.
The retest phase is the next critical step in the strategy’s development. There is an opportunity to enter a trade and profit as soon as the crypto cycle chart shows a retracement of the asset price back to the support or resistance level.
A price retracement that faces the opposite direction from the support/resistance levels, indicating the continuation of the trend seen before the break, shows a complete and confirmed retest pattern. This pattern is one of the best accessible crypto charts that beginners can learn quickly and see on the chart.
Why Are Crypto Charts Important?
The answer will be technical analysis. Because crypto graph analysis may assist investors in identifying market patterns and projecting future price movements of an asset, cryptocurrency charts are crucial for traders looking to locate the most beneficial chances in the market.
The ideas of Dow Theory still hold in today’s markets despite its over a century-long existence. It explains how to recognize and quantify markets, including crypto chart patterns. The following six Dow’s theory tenets highlight the significance of cryptocurrency charts:
- Asset prices include all information: The market factors in all available information when setting asset prices. An asset’s pricing already includes all relevant information, including its competitive advantage and profit potential.
- There are three main categories of market trends: The two main market tendencies are bull and bear markets. Corrections in bull markets and rallies in bear markets are examples of secondary trends in a market that typically run counter to the primary ones.
- There are three stages to the main trends. This covers the stages of accumulation, public involvement, and excess in a bull market. In contrast, the bear market moves through stages of distribution, public participation, and panic.
- There must be a correlation between market indices: To validate a new market trend, signals derived from one market index must match signals derived from another. A new market trend has not started if one market index indicates a recent primary downtrend and another indicates a primary upswing. However, traders can verify the start of a new market trend if both indices indicate the same upward or downward trend.
- Volumes and market trends should match up: In a bull market, volume should rise proportionally to market movements. Market volume should gradually decline in a bear market. In a bull market, a decline in market volume may indicate a bearish trend that could result in a bear market.
- The trend continues until a definite reversal occurs: Market trends continue until an apparent reversal occurs. Dow Theory highlights that until a clear reversal occurs, a market trend will continue regardless of daily price moves.
Additionally, you can use crypto patterns for risk management. Instead of making a few large trades, traders using the best crypto charts must make numerous tiny trades. H&S, resistance break, channel up or down, ascending or descending triangles, and so on have success rates of roughly 70%.
Conclusion
Traders should always create trading methods that, at the least, provide a course to follow in the hopes of making gains rather than losses before venturing into the wild world of cryptocurrency trading. Whether it is a Double Bottom’s optimistic signs or a Head and Shoulders’ bearish warnings, all crypto chart patterns breed amounts of uncertainty.
No pattern can guarantee a profit or loss; these chart patterns are probability trades based on past data, frequently impacted by outside market factors like news stories or black swan events. These best crypto charts will help you to understand the market better and make more money if you choose them wisely.
Frequently Asked Questions
1. How to read crypto charts?
The main points of attention while analyzing a crypto trend chart are observing the present trading activity in the market and identifying the trend lines that define a pattern’s limits. Acquiring knowledge of the patterns described in this handbook can also enhance success.
2. Do Crypto patterns work?
Chart patterns are helpful for cryptocurrency trading, particularly for long-term positions. Examining price activity and measuring investor interest makes it possible to determine the best entry position at a critical support level.
3. What’s the best pattern for crypto trading?
Head and Shoulder is the best pattern for crypto trading due to its accuracy, reliability, and assurance.
Recent Posts
- Crypto News
BOJ Hikes Interest Rates to 30-Year High, Will Bitcoin Repeat 20-30% Post-Hike Crashes?
The Bank of Japan (BOJ) raises its interest rates by 25 bps to 0.75%, the…
- Crypto News
Breaking: U.S. Senate Delays CLARITY Act again, Crypto Market Structure Vote Slips to Early 2026
The CLARITY Act is no longer expected to pass the U.S. Senate this year. Lawmakers…
- Crypto News
Breaking: Bitwise Files S-1 For SUI ETF With U.S. SEC
Crypto ETF issuer Bitwise is looking to add a SUI ETF to its growing list…
- Crypto News
Crypto Hacks 2025: North Korean Hackers Steal over $2B in ETH and SOL This Year
In 2025, crypto hacks increased significantly. The cybercriminals associated with the North Korean government stole…
- Crypto News
Universal Exchange Bitget Removes Barriers to Traditional Markets, Offers Forex and Gold Trading to Crypto Users
The number one universal exchange Bitget is removing barriers between crypto and traditional finance. It…
- Crypto News
Breaking: U.S. CPI Inflation Falls To 2.7% YoY, Bitcoin Price Climbs
The U.S. CPI inflation came in well below expectations, providing a bullish outlook for Bitcoin…