CyberVein Price Analysis: CVT Continues Extra-ordinary Bullish Run, Enroute To Break 2020 High-Day Close


- CyberVein has seen an extraordinary 567% price surge over the past 90-days of trading.
- The cryptocurrency managed to close at a high price of $0.03739 at the start of May.
CyberVein has been on a very impressive bullish streak over the past 3 months of trading as the cryptocurrency managed to surge by a total of 567% to reach the current price of $0.034. The cryptocurrency started to surge in March but really took off during April as it managed to spike to a high price at $0.05.
The coin has since dropped but is currently trading at $0.0341. CyberVein is ranked in the 109th position with a total market cap value of around $36 million.
CyberVein Price Analysis
CVT/USD – Daily CHART – SHORT TERM
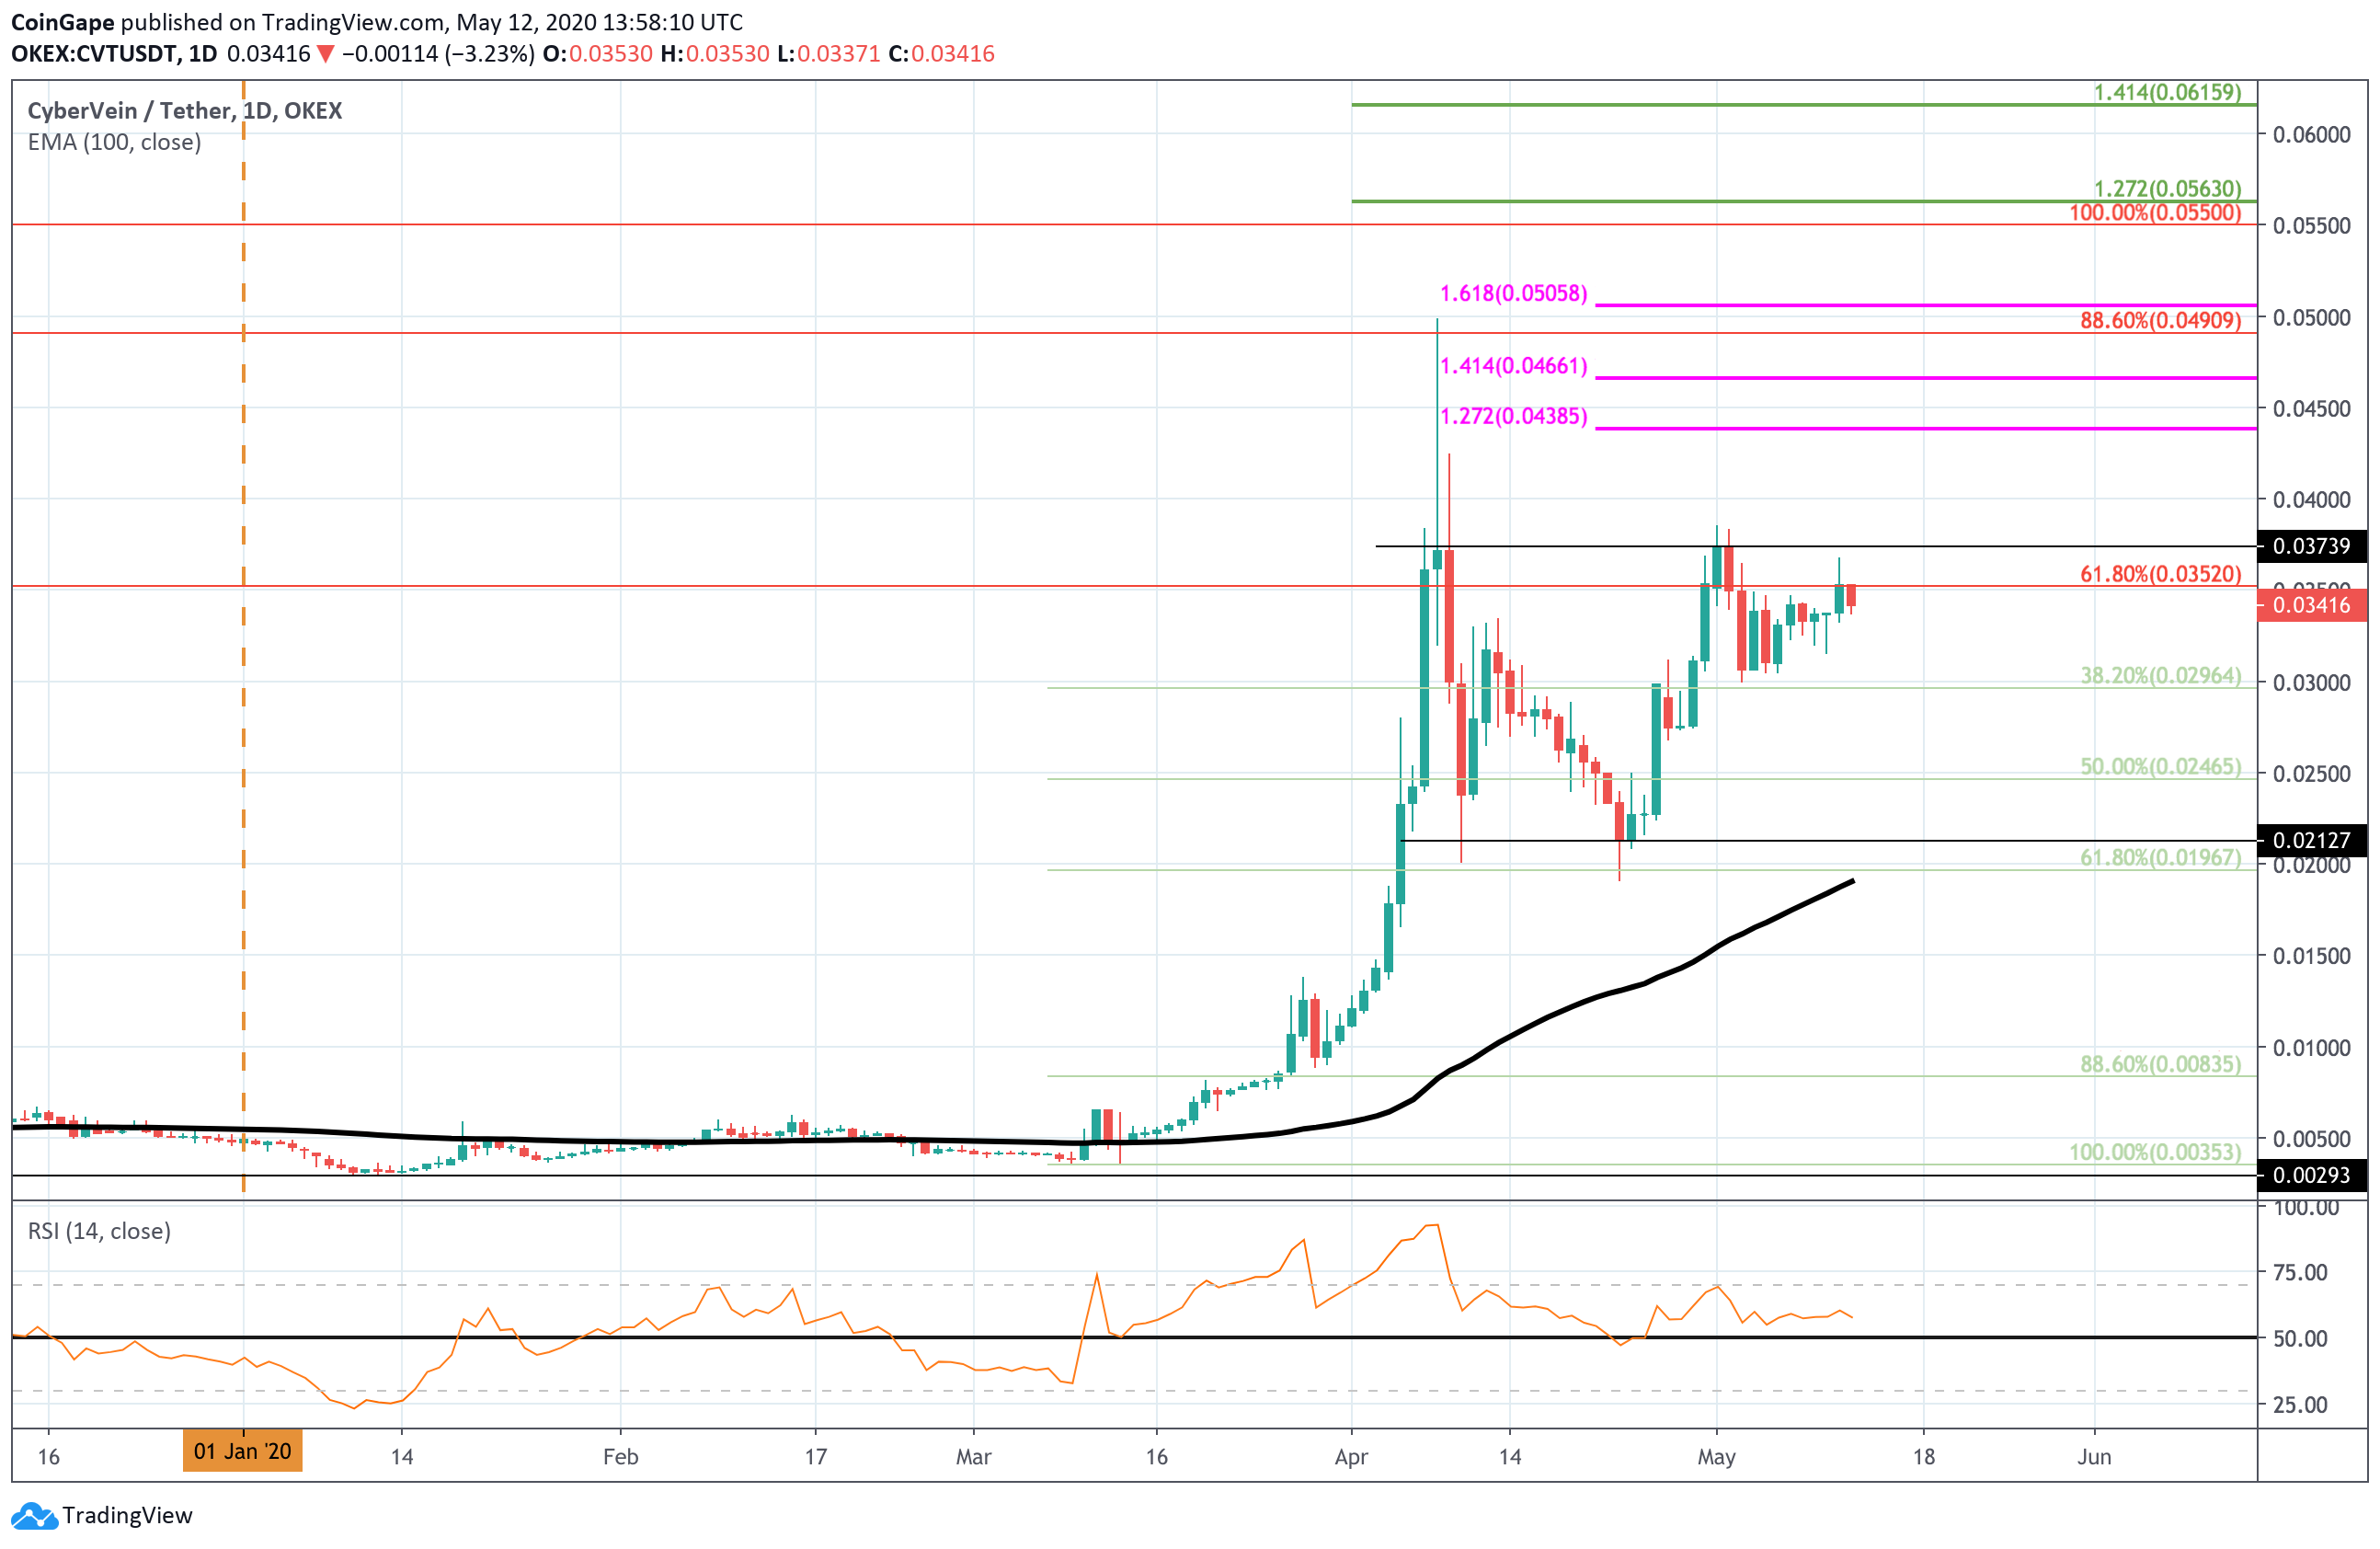
- Market Overview
Looking at the daily chart above, we can see that CVT started to explode during April 2020 as the cryptocurrency surged from $0.012 to spike as high as $0.05. It came down from $0.05 to close the session at a price of $0.0373.
As April progressed, we can see that CVT fell lower but managed to find solid support at the .618 Fibonacci Retracement level at $0.0196. If we were to drill down into the 4HR charts, we would see CVT rebounded perfectly from this support level.
After rebounding, CVT went on to recover for the remained of April 2020 as it reached back into the 2020 high-day closing price of $0.0373.
In May, we can see that CVT has traded within a range between $0.0373 and $0.03.
- Short term prediction: BULLISH
CVT is most certainly bullish at this moment in time and would need to break beneath $0.025 to turn neutral. A push beneath $0.02 (100-days EMA) would put CVT in danger of turning bearish.
If the sellers do push lower, the first level of support lies at $0.0296 (.382 Fib Retracement). Beneath this, support lies at $0.0246 (.5 Fib Retracement), and $0.0212.
Alternatively, if the bulls manage to break the resistance at $0.0352 (long term bearish .618 Fib Retracement), resistance is firstly located at $0.0373 (2020 high-day closing price). Above this, resistance lies at $0.04, $0.0438 (1.272 Fib Extension), $0.0466 (1.414 Fib Extension), and $0.049 (long term bearish .886 Fib Retracement).
- Key Levels
Support: $0.030, $0.025, $0.0212, $0.02.
Resistance: $0.0352, $0.0373, $0.04, $0.0438, $0.0466.

Why Trust CoinGape
CoinGape has covered the cryptocurrency industry since 2017, aiming to provide informative insights Read more… to our readers. Our journal analysts bring years of experience in market analysis and blockchain technology to ensure factual accuracy and balanced reporting. By following our Editorial Policy, our writers verify every source, fact-check each story, rely on reputable sources, and attribute quotes and media correctly. We also follow a rigorous Review Methodology when evaluating exchanges and tools. From emerging blockchain projects and coin launches to industry events and technical developments, we cover all facets of the digital asset space with unwavering commitment to timely, relevant information.

Delivered every day.
- Insights that move markets
- 100,000 active subscribers
Related Articles


- What Will Spark the Next Bitcoin Bull Market? Bitwise CIO Names 4 Factors
- U.S. CPI Release: Wall Street Predicts Soft Inflation Reading as Crypto Market Holds Steady
- Bhutan Government Cuts Bitcoin Holdings as Standard Chartered Predicts BTC Price Crash To $50k
- XRP News: Binance Integrates Ripple’s RLUSD on XRPL After Ethereum Listing
- Breaking: SUI Price Rebounds 7% as Grayscale Amends S-1 for Sui ETF
- Solana Price Prediction as $2.6 Trillion Citi Expands Tokenized Products to SOL
- Bitcoin Price Could Fall to $50,000, Standard Chartered Says — Is a Crash Coming?
- Cardano Price Prediction Ahead of Midnight Mainnet Launch
- Pi Network Price Prediction as Mainnet Upgrade Deadline Nears on Feb 15
- XRP Price Outlook Amid XRP Community Day 2026
- Ethereum Price at Risk of a 30% Crash as Futures Open Interest Dive During the Crypto Winter


