CoinGape has been covering cryptocurrency and blockchain markets since 2017. Our editorial team evaluates projects and platforms using structured review frameworks focused on transparency, utility, and risk assessment. You can explore our review methodologies to see how we assess and rate different categories. We maintain clear editorial standards and disclose advertising or affiliate relationships where applicable.
Knowledge is the only way to decipher the crypto world. With an in-depth understanding of the charts, traders can even make profits during crashes and rallies. Every trader, even a novice, has heard of the bull flag pattern among other technical patterns.
If you’ve read a few articles about bull flag patterns but still don’t understand them entirely, you’ve come to the right page. In the article, we are decoding the meaning of the “bull flag pattern,” why it occurs, and how to trace it.
Unlocking the secrets of the market involves understanding “continuation patterns,” the hidden clues that traders use to identify the trajectory of trends. Think of these patterns as the unique signatures of the market, appearing in various recognizable forms, with bull and bear flags leading the popularity charts.
Imagine a bull flag as a beacon of positivity during an uptrend, signaling that the price is likely to keep climbing. On the flip side, the bear flag emerges like a warning sign in a downtrend, suggesting that the price may take a further plunge.

The traders in the cryptocurrency market heavily rely on charting, also known as technical forecasts. The chart frequently shows a variety of patterns that predict how the currency will move in the future. One of them is the bullish flag in crypto. The appearance of the bull flag pattern suggests that the market is about to undergo a significant correction. Simply put, a rally is imminent for the market.
A mast that could be seen on either side of the parallelogram-like pattern indicates trend consolidation. The pattern appears when the market is extremely volatile and is either plummeting or rallying. A bullish flag in crypto is characterized by a flag of consolidation that is horizontal or downward-sloping and that is then followed by a sharp increase in the upward direction or the breakout. The said pattern is used when a market is strongly trending or after a breakout.
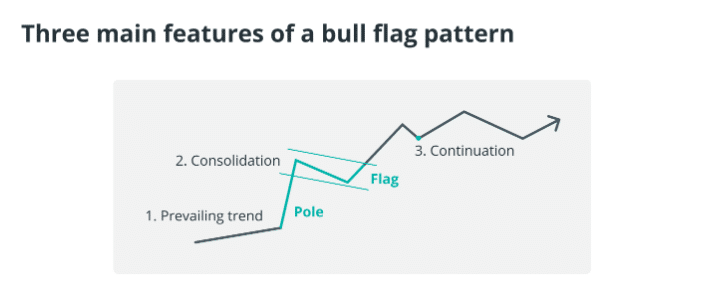
An appearance of a bull flag pattern is a solid hint that the token will soon improve significantly. The traders who successfully identify the pattern take home a sizable profit on their revenue chart. Understanding the bull flag pattern is essential because even a small error can result in major losses. Here is how you can identify a bull flag pattern:
The bull flag profit target can also be calculated using the price difference between the flagpole’s base and its highest point. Projecting the measured move to the upside beginning at the breakout point will help you determine your precise profit target.
The bullish flag in crypto represents a transient trend. However, it can stay for one to six weeks. The pattern has a more lasting effect than expected. Since the formation of the flag, the price has been rising, and it will keep doing so until the pattern is identified.
The most important sign while identifying the bull flag pattern is that after the formation of pole, there would be a small correction before the next jump. The volume of the currency also fluctuates during the correction period.
It can be very advantageous for traders to trade with a bull flag pattern. If you have seen a bull flag pattern, you can take the following action:
The cryptocurrency market is sprinkled with instances of bullish flag patterns, and one noteworthy occurrence was witnessed on the Bitcoin chart in early 2021. Following its peak in January, Bitcoin’s price underwent a consolidation phase, tracing out a rectangular shape on the chart. Once the consolidation period concluded, the price burst out of the flag pattern, embarking on a journey to reach new all-time highs.
Another compelling example unfolds on the Ethereum chart around mid-2020. After experiencing a notable surge in price, Ethereum engaged in a consolidation dance, forming a rectangular pattern over several weeks. When the consolidation curtain lifted, Ethereum broke free from the flag pattern, resuming its upward trajectory.
The chart’s bullish trends are very trustworthy. Many traders have benefited from it in the past, and it will do so in the future. Despite the fact that trading is inherently riskier than investing in commodities, futures, or cryptocurrencies, technical analysis has repeatedly shown its worth. As a result, new traders can depend on these indicators to close profitable deals and accomplish their objectives. However, the bullish flag in crypto does have some advantages and disadvantages, here are they:
The bull-flag pattern is fairly common on the charts. However, investors should be aware that trading has risks as well as rewards. Trading strategies and pattern recognition are merely predictions of the future; they do not represent reality. Anyone interested in investing should be aware of their capacity for risk because trading on the cryptocurrency market is very unpredictable.
Bull flags come in diverse forms, influenced by factors like volume and trader reactions to specific movements. These flags can take various shapes – some are straight, while others adopt a triangular form. Despite the array of possibilities, three prevalent bull flag variants frequently make their appearance.
1. Flat Top Breakout Pattern:

This pattern maintains resistance levels within the flag formation, aligning them with the height of the flagpole. A horizontal line marks the top of the pattern, while the bottom might ascend, forming a triangular shape known as a pennant. Traders favor this pattern as it typically avoids significant pullbacks in the price trend. It suggests a consensus between buyers and sellers on the crucial resistance level.
2. Descending Flag Pattern:

Trading in this pattern involves a pullback from the flagpole’s top, resulting in a common variant of the bull flag. The top and bottom lines create a parallel downward trend until an eventual breakout to the upside. Unlike a bearish channel, this short-term pattern indicates that buyers may need a breather, presenting a continuation pattern.
3. Bull Pennant:

Similar to the flagpole rise, the bullish pennant consolidates into a triangular shape. The top line descends, and the bottom line ascends, revealing a smaller trading window before a breakout. It signifies a bullish continuation pattern, extending the uptrend after consolidation. Unlike equal-distance trading levels, the converging lines suggest resistance and support levels narrowing before the eventual breakout.
In the realm of technical analysis, the bull flag pattern is generally deemed reliable. It serves as a bullish continuation pattern, indicating a resurgence of the upward trend after a consolidation phase.
Why It’s Reliable?
While the bull flag pattern is a trusted ally, there are instances of failure. Traders are advised to complement their analysis with other technical tools to validate their trading decisions.
The bull-flag pattern is fairly common on the charts. However, investors should be aware that trading has risks as well as rewards. Trading strategies and pattern recognition are merely predictions of the future; they do not represent reality. Anyone interested in investing should be aware of their capacity for risk because trading on the cryptocurrency market is very unpredictable.
1. How Long Can You Expect Bull Flags to Last?
Cryptocurrency prices are a rollercoaster ride, demanding trading strategies that mirror this volatility. While predicting the exact duration of chart patterns, like the bull flag, is akin to catching lightning in a bottle, a ballpark estimate is one to six weeks. In the unpredictable world of crypto, where momentum hinges on external forces, the bull flag becomes a tool for traders to harness and profit from prevailing market trends. Once identified, brace yourself for the continuation of the bullish trajectory.
2. Is Trusting a Bull Flag a Wise Move?
Bull flags are the golden ticket to an uptrend on a trading chart, making them favorable signals for traders. However, rushing in too early during pattern formation can be a costly misstep. The prudent move is to exercise patience, awaiting confirmation as the price breaks above the upper trend line before making your move. A measured approach ensures a safer journey through the bullish landscape.
3. How is a bear flag different from a bull flag?
Picture a bear flag as the mirror image of its bullish counterpart. Both flaunt the familiar flag-and-pole setup, but their directional trends set them apart. The bear flag, a bearish signal, emerges in a downtrend, while the bull flag, radiating positivity, graces an uptrend. It’s a tale of two flags, each telling a different story on the trading chart.
4. What’s the bull/bear flag’s mission?
In the realm of chart patterns, the bull flag’s mission aligns with the broader goal – providing traders the chance to ride the wave of market momentum. By scrutinizing the pattern’s trajectory, traders can strategically pinpoint entry and exit points. While no pattern guarantees unending rewards, they do serve as risk mitigators, offering traders a more calculated dance in the market’s unpredictable rhythm.
5. How to identify if it’s a bull flag or a bear?
Distinguishing between a bullish and bearish flag pattern involves a keen eye on the price trend and its accompanying volume. A bull flag unveils itself after a spirited price rally, marked by high volume, followed by a flag-shaped consolidation where volume tapers off. On the flip side, a bear flag emerges from a downtrend, and its consolidation phase doesn’t always witness a decline in volume, thanks to market fear and anxiety spurring action. It’s a nuanced game of deciphering signals in the market’s emotional landscape.


 50k+ Articles