CoinGape has been covering cryptocurrency and blockchain markets since 2017. Our editorial team evaluates projects and platforms using structured review frameworks focused on transparency, utility, and risk assessment. You can explore our review methodologies to see how we assess and rate different categories. We maintain clear editorial standards and disclose advertising or affiliate relationships where applicable.
Technical patterns on the trading charts are the guiding light for the traders. These indicators often help traders to project the upcoming loss or profit. Many trading indicators that assisted investors in making money in stocks found their way to the cryptocurrency markets. One of them is Hammer Candlestick Pattern.
The hammer candlestick pattern is effective in several financial markets, including the crypto market. It is one of the most popular candlestick patterns traders use to analyze price movement and calculate the probability of outcomes.
The hammer candlestick pattern can point to potential trading opportunities when combined with other crypto trading strategies like fundamental analysis and other market analysis tools. This article will explain hammer candlestick patterns and how to read them.
As prices decline, more sellers enter the market, creating the hammer candlestick. By the time the market closes, buyers have absorbed all of the selling pressure, pushing the market’s price close to its opening.
The closing price can be higher or lower than the opening price, but for the real body of the candlestick to stay small, the closing price should be close to the opening.
Hammer candlesticks suggest a possible upward price reversal. Following the hammer, the price must begin moving upward, referred to as confirmation.
A hammer signal indicates that the market is trying to identify a bottom when it appears after a token‘s price has been falling.
Hammers indicate a potential seller capitulation to form a bottom and are followed by a price increase to suggest a potential price direction reversal. The price declines after the opening but recovers to close to the opening price. This all takes place in a single period.
The shape of a hammer is in the form “T.” In the absence of confirmation, a hammer candlestick does not suggest an upward price reversal.
If the candle that follows the hammer closes higher than the hammer’s closing price, confirmation has occurred. This confirmation candle should display significant buying. Typically, traders will try to enter long positions or exit short positions during or after the confirmation candle when dealing with candlesticks. If you are starting new long positions, you can set a stop loss below the low of the hammer’s shadow.
Even with verification, hammers aren’t typically used alone. Traders frequently use price analysis, trend analysis, or technical indicators to validate candlestick patterns further. All time frames exhibit hammers, including one-minute, daily, and weekly charts.
Hammer candlestick patterns are mainly of two types: bullish hammer and bearish hammer. It is further divided into sub categories to help traders identify it better.
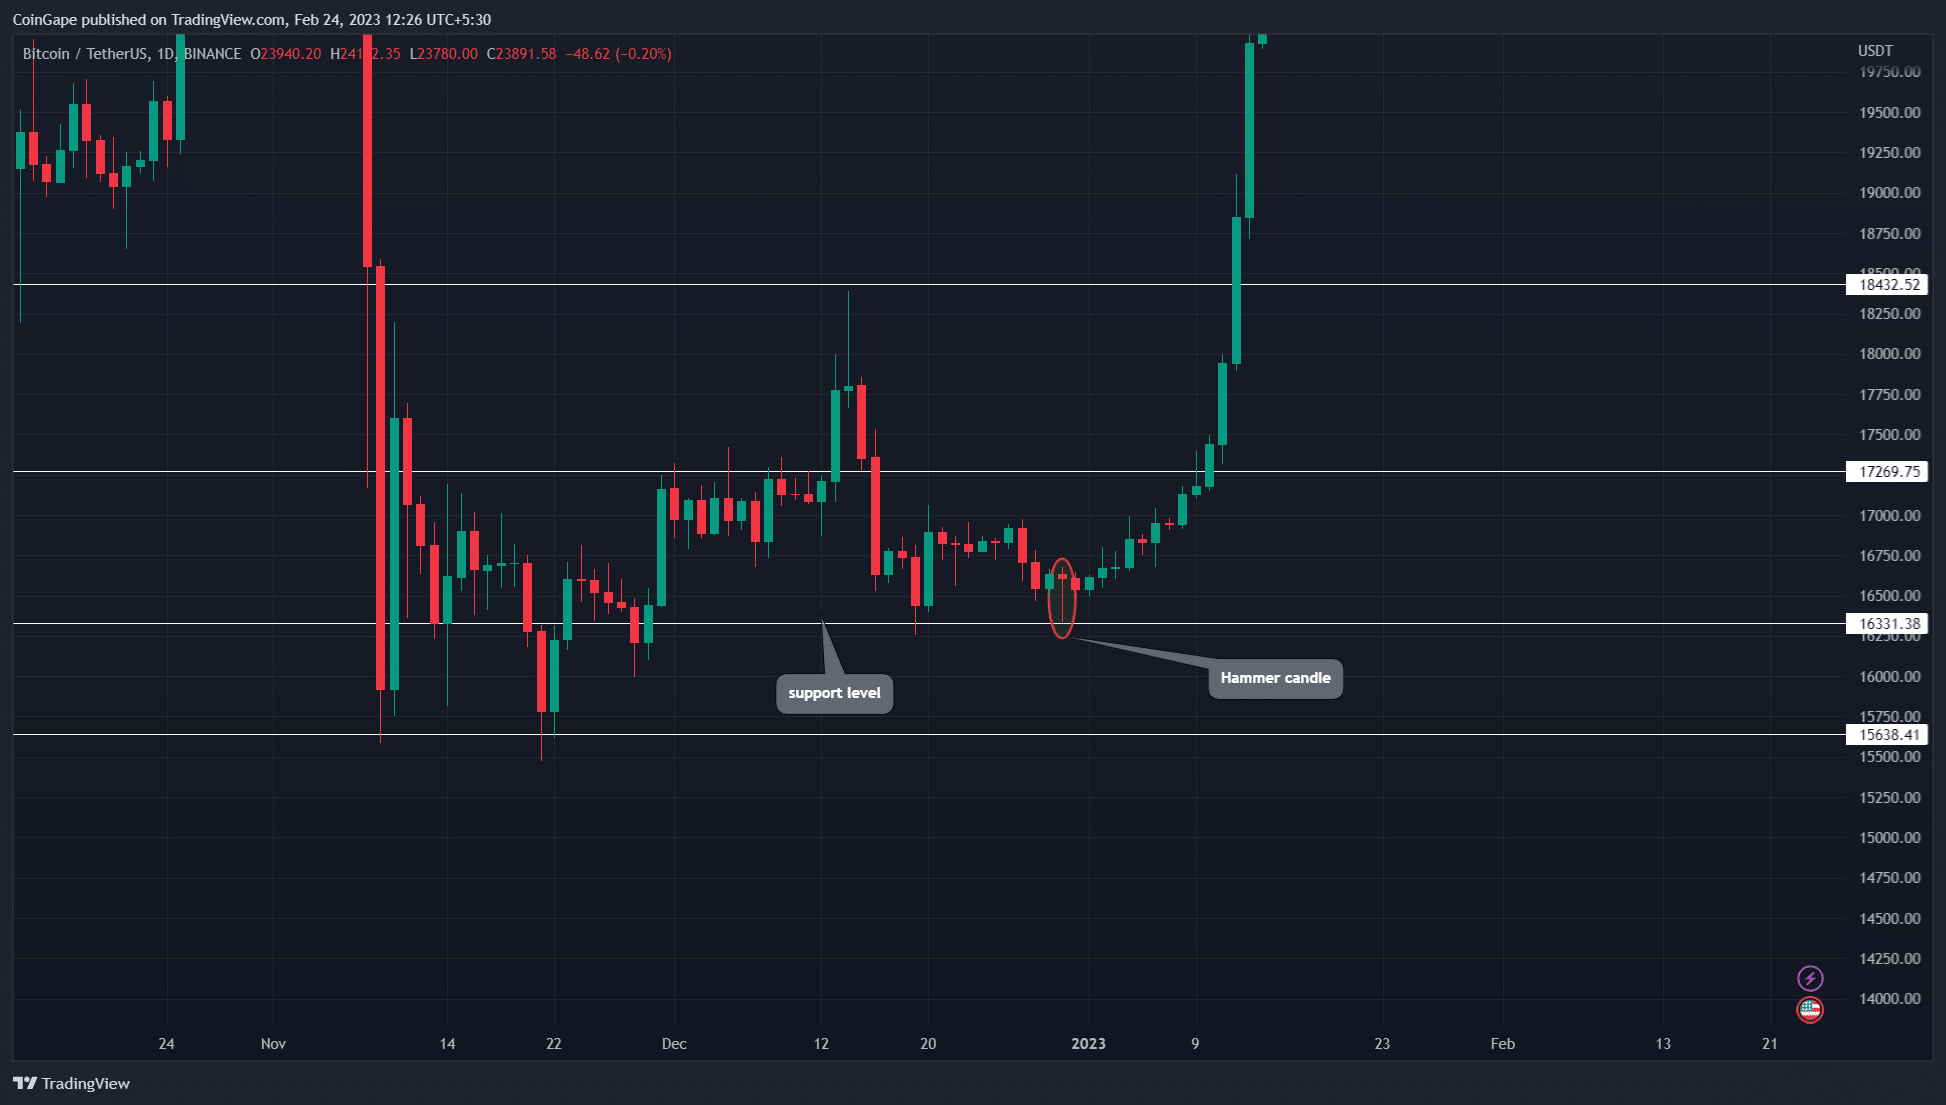
Here is an example of the BTC/USDT chart over a 3-month period to help you better understand the candlestick pattern. On the chart below, you can see that the bitcoin price has once again tested the $16330 support level. The hammer candle formation indicates buyers continue to gather at this level, driving the price higher.
Here the hammer candlestick is formed with a small body and a long lower wick. The price is pushed lower by sellers before being pushed back up by buyers for correction.
A hammer candlestick pattern is an effective tool for traders to identify potential trend reversals, but it doesn’t always indicate a buy or sell signal. Like other trading strategies, Hammer candles are more effective with additional technical indicators and analysis tools. Assessing the reward to risk of your trades is a crucial component of risk management.


 50k+ Articles