CoinGape has been covering cryptocurrency and blockchain markets since 2017. Our editorial team evaluates projects and platforms using structured review frameworks focused on transparency, utility, and risk assessment. You can explore our review methodologies to see how we assess and rate different categories. We maintain clear editorial standards and disclose advertising or affiliate relationships where applicable.
Whether you are trading cryptocurrencies or shares of a company, examining the previous price chart patterns is essential. Analyzing previous price behaviors help you project possible future patterns, which in turn helps you make better trading decisions. In this regard, popular trend lines come into picture, simplifying the way we analyze price chart patterns.
If you are a beginner trader trying to make sense of the fluctuating crypto market prices of cryptocurrencies, this is the article for you. Here, we will explain two popular trend lines, support and resistance, in detail to help you analyze price chart patterns. By the end of the article, you will know how to draw trend lines and estimate the future price of trading assets.
Trend lines are lines that are easily noticeable in the price chart of a financial instrument. Even though the price points in a chart move based on market conditions, when all of them are present in a chart, they form a pattern. The result of all the previous price points in a chart form a line, whether upward or downward, which is widely known as a “trend line”.
After forming a trend line with the existing price points in a chart, traders can project it further to see where the next price points can be located. It gives you an idea of in which direction the price chart pattern will move in the future. Thus, trend lines are the best options to rely on in the technical analysis of a financial instrument.
The way how trend lines move will depend on the formation of price points in a chart. No matter the short-term price fluctuations, the prices of a cryptocurrency at different points in time will form either an uptrend or a downtrend over a period of time. The following are two major types of trend lines – Support and Resistance.
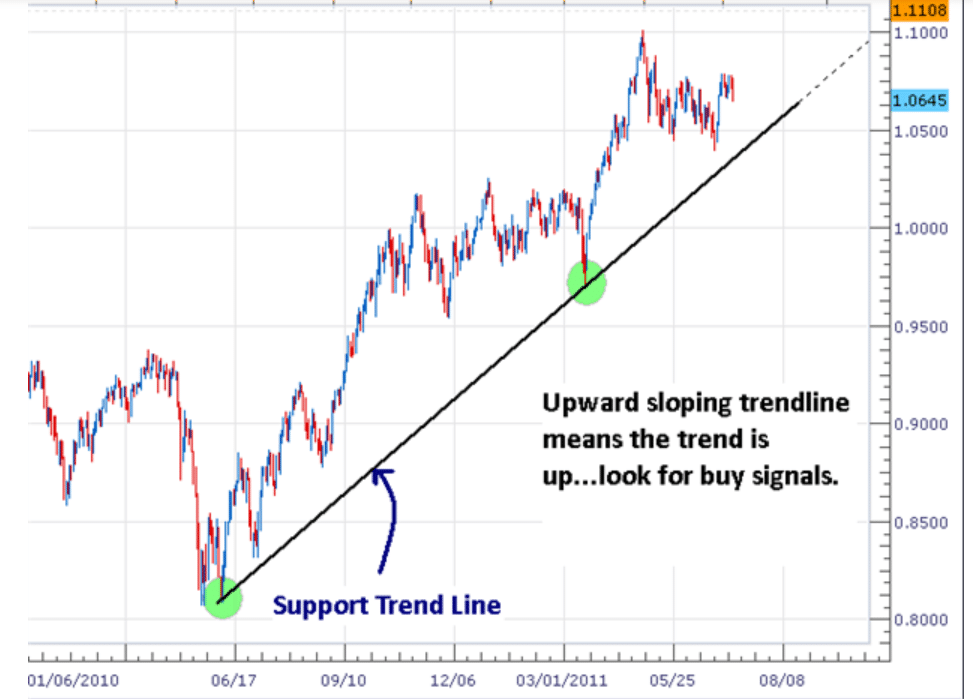
Trend lines connect a bunch of price points together to make sense of the scattered prices in a chart. When this formed trend line is sloping upward, it is known as an upward trend line.
One of the important things to pay attention to while drawing trendlines is which price to consider. Because there are four different types of prices – open price, close price, low price, and high price.
While open price is the starting trading price of a cryptocurrency, close price is the price at which the market closed that day. High price and low price in a time period are self explanatory. However, you can choose the price based on your preference.
The upward trend line connects all the price points which are going in an upward direction. The upward trend line is also known as the support trend line because it shows the support area of the price chart beyond which the price does not drop. This trend indicates that the price of the respective cryptocurrency is about to go on an uptrend in the future. As a result, it might be the best time for you to buy the cryptocurrency to profit from the upward trend.
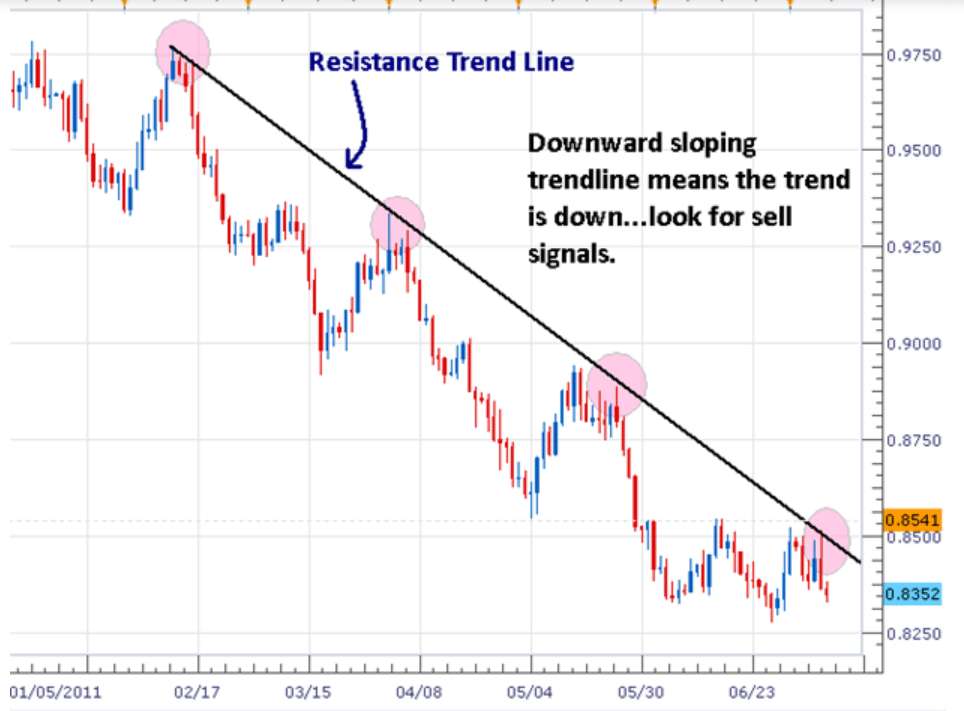
Resistance trend line or downward trend line connects all the price points that form a downward slope in the price chart. While the upward trend line indicates that the future movement of price is going upwards, the downward trend line indicates that the price is about to drop further.
The downward trend line demonstrates a resistance zone in the price chart, beyond which the price of the underlying asset does not cross. This indicates that the price does not go above the resistance zone or the downward trend line. Since it is clear that the price does not go above the resistance zone, it is better not to expect any profits in the near future and is not the best time to buy the asset.
While the support and resistance trend lines or the upward trend line and downward trend line gives you a clear picture of where the price would go in the near future, you cannot depend on them completely to make investment decisions. This is because there are also other factors that come into play when it comes to trading any financial instrument.
Especially, the risk is high if it comes to cryptocurrencies since they depend on a multitude of factors and are extremely sensitive to market news, announcements, and latest updates in the industry. While drawing trend lines is an essential part of your technical analysis, you must also consider fundamental factors and the ins and outs of the underlying asset with proper research before investing your money into an asset.


 50k+ Articles
 Buy $GGs