What is Doji candle pattern in crypto and how to trade with it?
Introduction
Technical patterns on the chart have often aided traders, especially in volatile markets such as cryptocurrencies. These patterns or signs act as a guiding light for short-term traders. One of them is the Doji candlestick or Doji star.
In the article below, we will explore the aspects of Doji candlesticks, types, and trading suggestions lining with the pattern. Let’s begin.
What is Doji candle pattern?
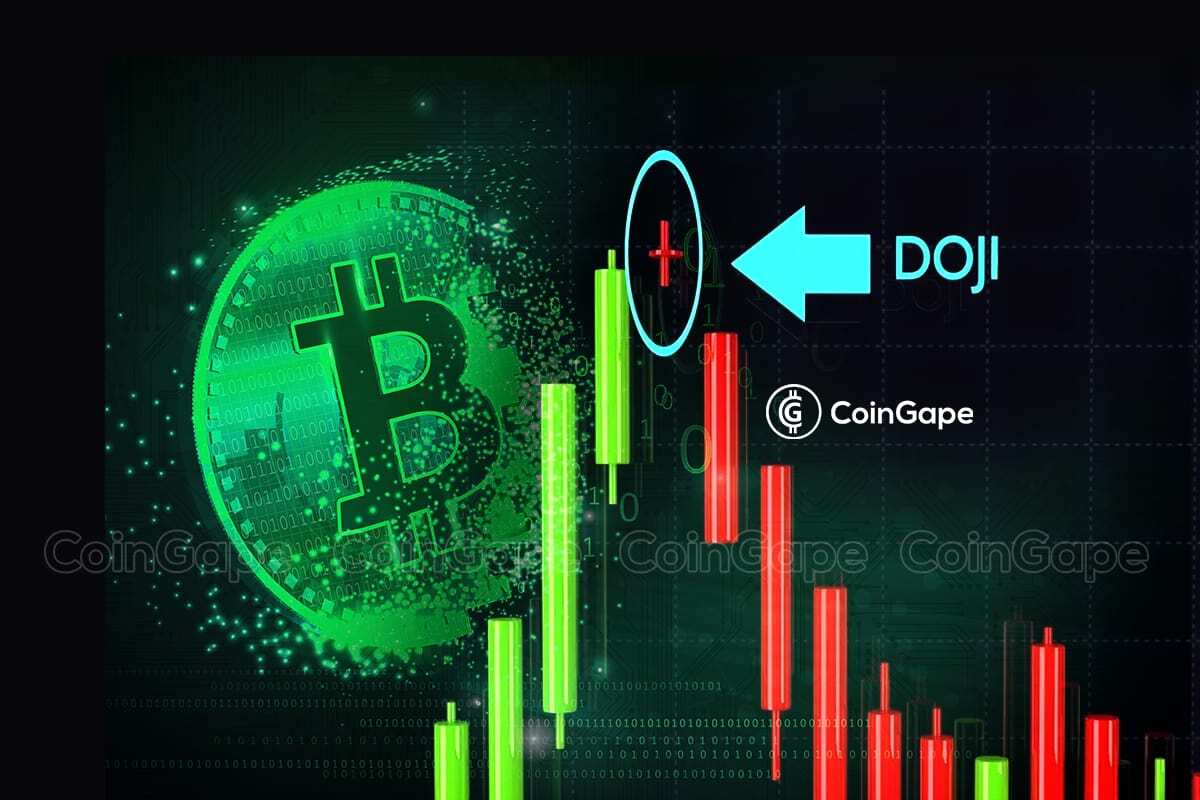
The Doji candlestick is also known as the Doji star. The pattern’s appearance indicates that the traders are indecisive about the coin. The doji candlestick is confirmed when the opening and closing prices of the token are almost the same.
Key takeaways
A trading session is known as a “doji” when a security’s open and close are almost equal.
There are three main categories of doji formations: long-legged, dragonfly, and gravestone.
Typically, a Doji signifies that the buyers and sellers of an asset balance one another out. It is a sign that the sellers have rejected all attempts of buyers to bring down the price and vice versa. A doji candlestick, though uncommon, typically indicates a market reversal. Moreover, it can also indicate uncertainty about future prices. Candlestick charts offer an overview of market movements. These chart patterns also act as indicators for market activities and sometimes reactions.
In the end, both sides drive the cost to a pivot point. So, for instance, even though the price of Cardano (ADA) fluctuated between $0.384 and $0.256 during a given day, when it tickers down $0.33, it starts and closes at $0.30 instead.
Doji candlesticks might have the shape of a dragonfly, a gravestone, or a neutral. Analysts and investors attempt to predict price behavior based on these shapes.
Types of Doji Patterns
As mentioned above, Doji candlestick varies based on the shadow’s length or position. Here are the most common variations:
- Dragonfly: A T-shaped candlestick with a long narrow wick and nearly no higher wick represents the Dragonfly Doji shape. It indicates that the opening, closing, and high price are nearly equal. This pattern might be interpreted as a purchase signal if it appears near the end of a downturn. On the other hand, the candlestick’s appearance during an upswing suggests a possible reversal.
- Long-legged: The longer wicks on the long-legged Doji suggest that both buyers and sellers made aggressive attempts to control the price movement at some point during the candlestick’s span. Traders should pay close attention to the candlestick during the closing price while looking for a potential long-legged Doji candlestick. If the closing price is less than the candle’s middle section, it is a red flag, especially around resistance levels. Contrarily, if the closing price is higher than the candle’s centre, the structure resembles a bullish pin bar pattern and is, therefore, bullish.
- Neutral: It comprises a nearly undetectable body in the middle and equivalent wicks on both the lower and upper ends. To help spot probable market tops and bottoms, traders can combine the neutral Doji with momentum indicators like the RSI or Moving Average Convergence Divergence (MACD). This pattern emerges when bearish and bullish inclinations are evenly balanced.
- Four price: It primarily emerges in low-volume situations or for extremely brief periods on the candlestick price chart. Interestingly, it resembles a minus sign and implies that the opening, closing, peak, and low prices for a certain period are all at the identical level.
- Gravestone: It is a reverse T-shape candlestick with the opening and closing candles falling on the low. The candlestick shows that investors tried to drive up the price but could not maintain the positive momentum.
How do Doji candles function?
Doji candlesticks have aided traders in predicting market fluctuations. It is important to remember that the Doji pattern does not always indicate a trend reversal. Instead, it reveals traders’ uncertainty about potential developments.
For instance, a Doji candlestick that appears during an upswing may be a sign of bulls’ exhaustion, which is when more buyers start to lean toward the sellers, and the trend begins to reverse.
Therefore, using more technical indicators to verify the Doji candlestick indication is preferable. The RSI or others, for example, can offer extra significance to what the Doji pattern says.
Is the Doji candle pattern dependable?
It is preferable for seasoned traders who can quickly recognize and correctly analyze the offered signals to develop a trading strategy based on Doji candle patterns. The Doji candlestick pattern and other indicators might provide the most significant buy or sell indications in technical analysis.
Being said that, it is a valuable market indicator to consider when determining the level of uncertainty among buyers and sellers.
Recent Posts
Crypto Debit Card vs Traditional Debit Card: Key Differences
Traditional debit cards have been on the scene for decades now and have become one…
Custodial vs Non-Custodial Crypto Cards Explained
Highlights Crypto Cards enable seamless payments at the point of sale using cryptocurrencies. Crypto cards…
- Education
Which Crypto Exchanges Reduced Fees in 2025? (Tracker)
Crypto exchange fees matter, especially for active traders. In 2025, the competition between major exchanges…
How to Verify Presale Smart Contracts Before Investing
Cryptocurrency presales are a good way to get into promising crypto projects at an early…
UniSwap Airdrop: A Case Study
If you've been around Web3 for a while, you’d agree that the Uniswap airdrop was…
- Education
Crypto Maker vs Taker Fees Explained: A Simple Guide
If you’ve been trading crypto for a bit, you already know fees can be confusing,…