Ethereum Price Rally Awaits This Bullish Pattern Confirmation
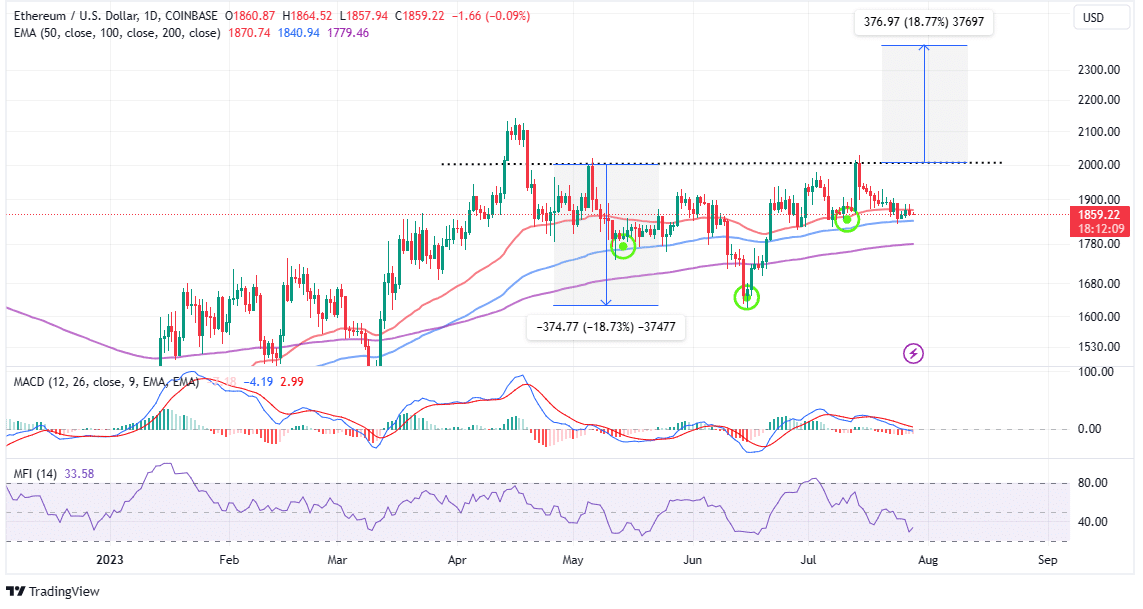
Ethereum price has steadied above $1,800 for nearly two months and traded at $1,864 on Friday. On the upside, price action has been capped under $2,000, amid a general slump in the trading volume.
Following the Ripple ruling in early July, investors focused less on Bitcoin (BTC) and Ethereum, favoring other leading altcoins like XRP, Cardano (ADA), Polygon (MATIC), Solana (SOL), and most recently Dogecoin (DOGE).
The biggest task among Ethereum is holding the price above $1,800 – a move likely to prevent possible declines to $1,700 and $1,600.
If a recovery ensues from the current market value, the token powering the largest smart contracts token might trigger a surge in investor interest, who are still waiting on the sideline for an uptrend confirmation above $2,000.
Here’s What It Will Take Ethereum to Rally?
Ethereum price is in the middle of nurturing a potentially massive breakout that could propel it not only above $2,000 but allow bulls to close the gap to $2,400 for the first time since May 2022.
The daily chart shows the formation of an inverse head-and-shoulders (H&S) pattern, promising a 19% bullish move to $2,385.
The inverse H&S pattern shows a downtrend ending and an uptrend starting. It has three lows: the middle one is the lowest (head) and the outer ones are higher (shoulders).
This pattern is validated when the price breaks above a line joining the highs of the shoulders (neckline), located around $2,000 for Ethereum price.
Traders are always advised to buy when this happens or wait for a pullback to the neckline to be certain that the breakout is sustainable and not a bull trap. Note that the price target is the distance from the head to the neckline (19%) added to the breakout point.
Other indicators must be consulted when trading the H&S, especially the Money Flow Index (MFI), which monitors the inflow and outflow of funds in Ethereum markets. That said, the MFI as presented on the daily chart, has a bullish outlook, which implies that a breakout is in the offing.
Evaluating the Bullish Case in Ethereum Price
Adding credence to the bullish outlook on the daily chart is the Moving Average Convergence Divergence (MACD) indicator – likely to send a buy signal over the weekend.
Traders seeking fresh exposure to ETH long positions should be on the lookout for bullish crosses in the momentum indicator, marked by the MACD line in blue crossing below the signal line in red.
To be on the safe side, Ethereum price must break and hold above the immediate hurdle, as highlighted by the 50-day Moving Average (EMA) at $1,870. Profit booking can start at $2,000 but extremely bullish traders may want to hold on for the H&S pattern breakout to $2,385.
Related Articles
- Binance Calls Out Regulatory Overreach by CFTC, Asks Court to Dismiss Lawsuit
- FTX And Genesis Settle Disputes In Bankruptcy Cases, Good News for Gemini?
- Expert Predicts 400% Jump For Terra Classic (LUNC) Price; Here’s Timeframe
Recent Posts
- Crypto News
Breaking: Rep. Max Miller Unveils Crypto Tax Bill, Includes De Minimis Rules for Stablecoins
Rep. Max Miller is circulating a 14-page draft of a proposed crypto tax bill in…
- Crypto News
XRP Holders Eye ‘Institutional Grade Yield’ as Ripple Engineer Details Upcoming XRPL Lending Protocol
Ripple engineer Edward Hennis has provided key details about the upcoming XRP Ledger (XRPL) lending…
- Crypto News
Michael Saylor Sparks Debate Over Bitcoin’s Quantum Risk as Bitcoiners Dismiss It as ‘FUD’
Strategy co-founder Michael Saylor earlier this week commented on the risk of quantum computing to…
- Crypto News
Ethereum Faces Selling Pressure as BitMEX Co-Founder Rotates $2M Into DeFi Tokens
Ethereum is under new sell pressure after a high-profile crypto trader sold his ETH assets…
- Gambling
Best Crypto Casinos in Germany 2025
If you’re a German gambler tired of strict limits and slow payouts at locally licensed…
- Crypto News
Tom Lee’s Fundstrat Warns Clients Bitcoin Could Fall to $60,000 Despite His ATH Public Forecast
Top asset manager Fundstrat has advised its private clients to expect a pullback in Bitcoin…