HBAR Price Prediction: Hedera Hashgraph (HBAR) In Full Moon Mode As Price Confirms Hidden Bullish Divergence On The Weekly Charts


HBAR, the native token for the Hedera Hashgraph ecosystem maintains a bullish outlook following the recent launch of Circle’s USDC stablecoin on the HBAR ecosystem. Why, recently Circle’s VP of Product Joao Reginatto in an interview with CoinDesk, highlighted the need to prioritize the HBAR token ecosystem earlier this year, owing to its power for more enterprise use cases.
Going forward, the USDC on Hedera will be compatible with existing Circle Accounts and Circle Payments, Payouts, and Accounts APIs as stated in a recent press release.
Read on as we analyze the demand and supply of HBARBTC and HBARUSDT below.
HBAR Price Analysis: HBARBTC Weekly Chart Analysis
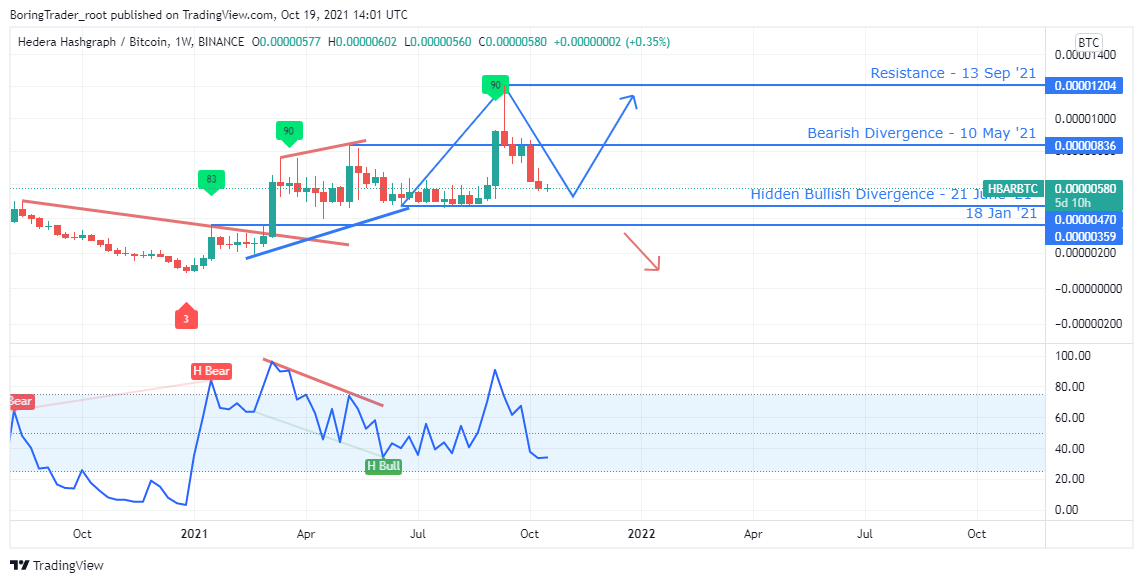
The recent rise in Bitcoin BTC dominance forced a decline in demand for major altcoins, including the HBAR crypto-asset.
Conversely, higher RSI readings above level-25 and level-75 indicate that this may not last for long as an impending bullish divergence at press time could resume demand for the HBAR crypto.
HBAR Price Analysis: HBARUSDT Weekly Chart Analysis
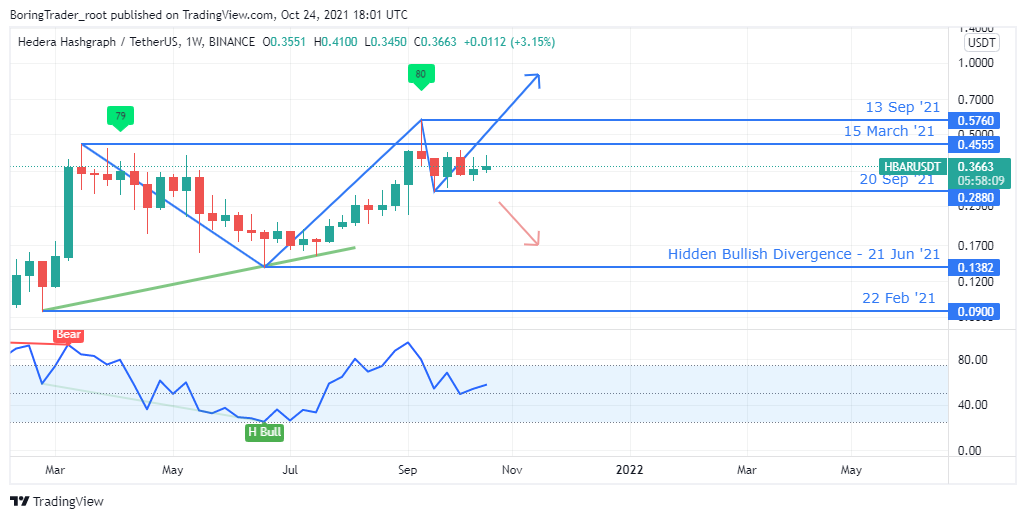
Higher RSI readings above level-25 and level-75 alongside the hidden bullish divergence on 21 June suggests that the bulls are still in control of the market.
A price dip following a new ATH at 0.5760 implies that the HBAR price is in a correction phase where the entry signals to resume the uptrend will be triggered by an oversold level on the daily time frame.
Let’s move on to the daily time frame below.
HBAR Price Analysis: HBARUSDT Daily Chart Analysis
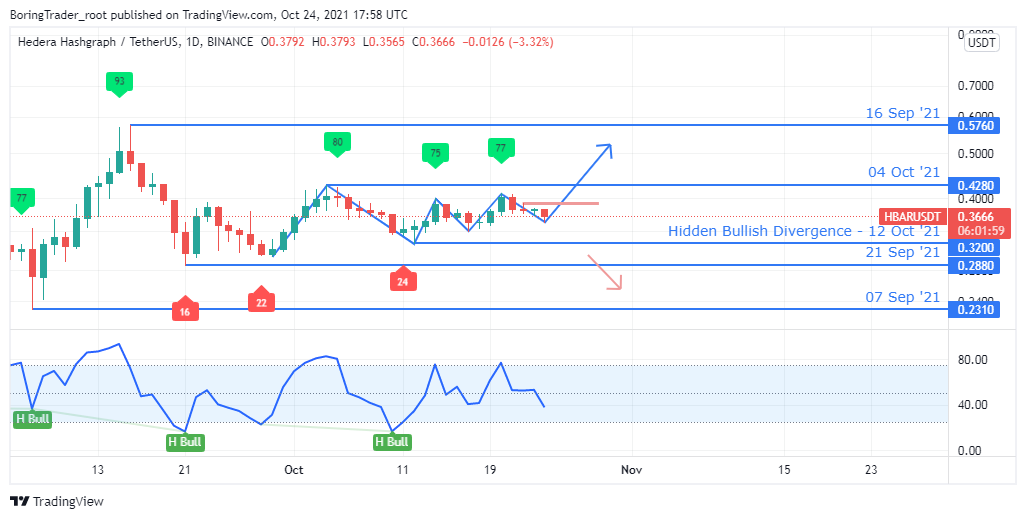
The HBARUSDT trades in a range-bound market structure as revealed from the chart above.
A series of hidden bullish divergence on 21 September and 12 October shows a bias to the upside, which hints that the HBARUSDT could likely break the 0.4280 resistance.
Conversely, a breach of the 21 September [0.2880] low suggests low interest for the HBAR cryptocurrency and higher selling pressure to come.
Note that the bullish divergence was triggered while the RSI was in oversold territory, an indication that the bulls may have found a price floor.
HBAR Price Analysis: HBARUSDT 4 hr Chart Analysis
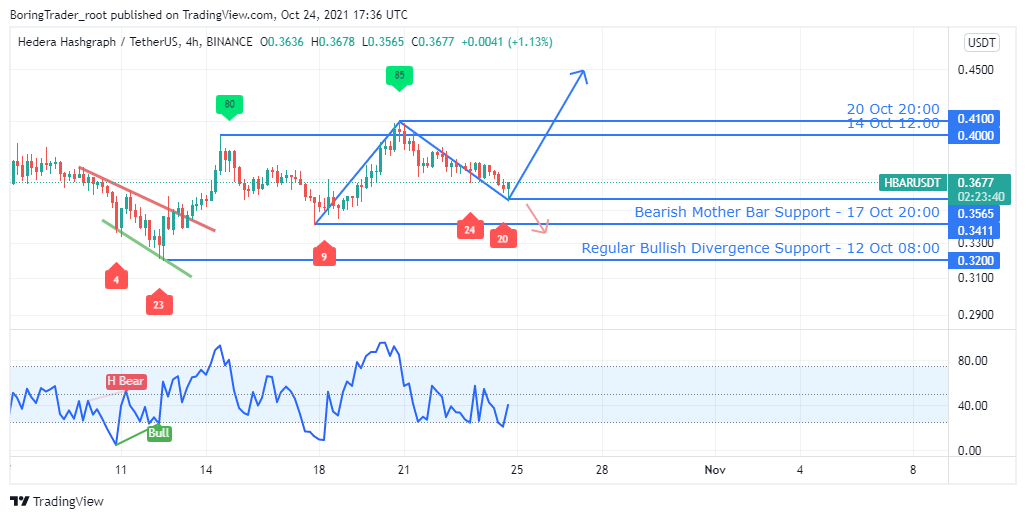
The HBAR crypto-asset forms higher peaks and troughs with the recent trough formed after the RSI dipped below level-25 on 24 October 16:00.
Similar to the daily time frame and weekly time frame combination of exit of level-75 [weekly chart] and entry of oversold level-25 [daily], the 4HR time frame also enters the oversold area, while the daily time frame trades above level-25 on the daily time frame at press time.
This is generally a bullish signal for the HBARUSDT. We expect the bullish momentum to persist considering the recent positive developments taking place within the HBAR ecosystem.

Why Trust CoinGape
CoinGape has covered the cryptocurrency industry since 2017, aiming to provide informative insights Read more… to our readers. Our journal analysts bring years of experience in market analysis and blockchain technology to ensure factual accuracy and balanced reporting. By following our Editorial Policy, our writers verify every source, fact-check each story, rely on reputable sources, and attribute quotes and media correctly. We also follow a rigorous Review Methodology when evaluating exchanges and tools. From emerging blockchain projects and coin launches to industry events and technical developments, we cover all facets of the digital asset space with unwavering commitment to timely, relevant information.
Delivered every day.
- Insights that move markets
- 100,000 active subscribers
Related Articles


- Is Bhutan Selling Bitcoin? Government Sparks Sell-Off Concerns as BTC Crashes
- ‘XRP Treasury’ VivoPower Abandons Crypto Strategy Amid Market Crash, Stock Price Dumps
- Bitcoin Crashes to $65K as Crypto Market Erases $2T in Market Cap Since October Record High
- Trump’s World Liberty Financial Dumps Bitcoin as BTC Falls Back to 2021 ATH
- CLARITY Act Markup Still On Course as Senate Puts Crypto Bill on Schedule, Lummis Assures
- Dogecoin, Shiba Inu, and Pepe Coin Price Prediction as Bitcoin Crashes Below $70K.
- BTC and XRP Price Prediction As Treasury Secretary Bessent Warns “US Won’t Bail Out Bitcoin”
- Ethereum Price Prediction As Vitalik Continues to Dump More ETH Amid Crypto Crash
- Why XRP Price Struggles With Recovery?
- Dogecoin Price Prediction After SpaceX Dogecoin-Funded Mission Launch in 2027
- Solana Price Crashes Below $95 for the First Time Since 2024: How Low Will SOL Go Next?


