Litecoin Price Analysis: Holding Above 36.8 Level That Can Hold
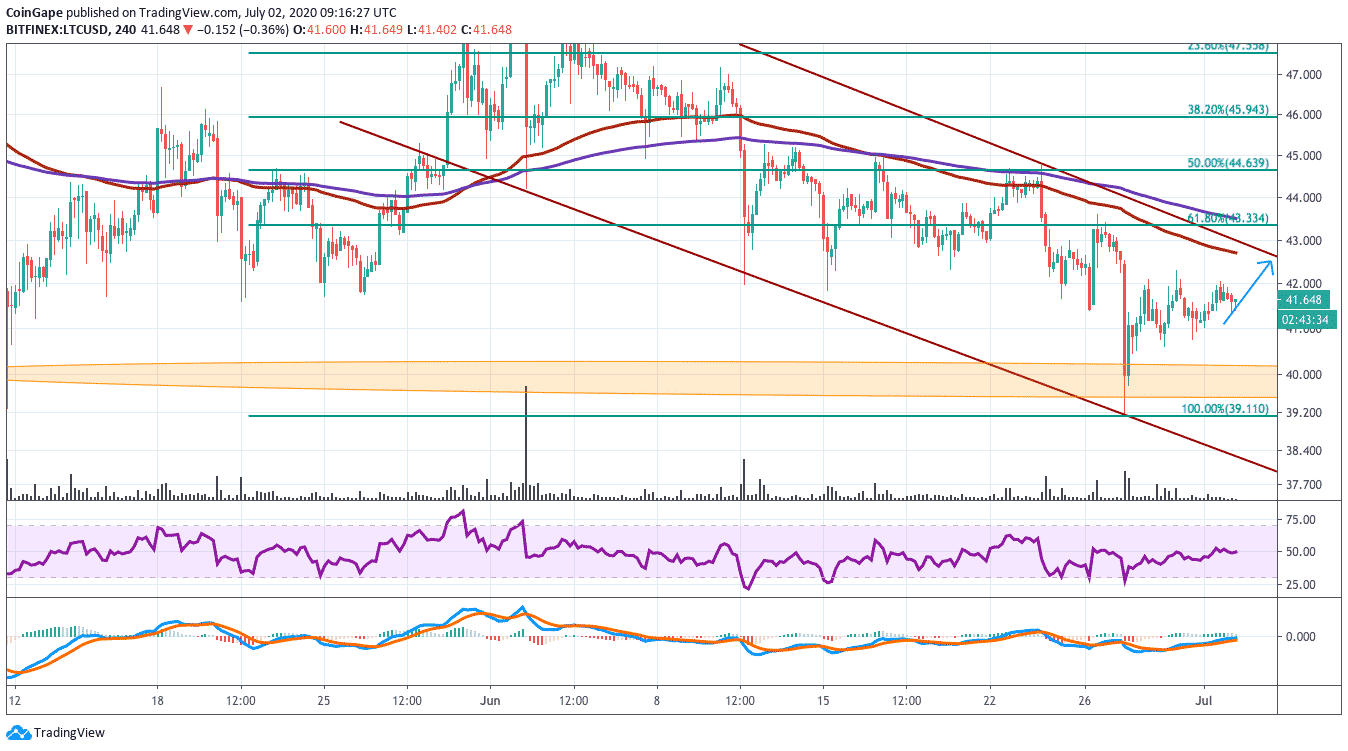
LTCUSD is trading above the important 36.8 level where it has some strong support and where it bounced already several times in the last days and weeks, therefore, this is primary support that can hold. LTCUSD is trading below the 200 and 100-EMA which makes it currently more bearish but the fact that there is much room to go and test the EMAs makes it an interesting conclusion that can confirm further.
LTCUSD Price Analysis Chart
Also LTCUSD is building a donwtrend channel here which can confirm either to the upside or stay more in the
downtrend channel before it confirms to the upside like it is often the case in such a structure.
Above the downtrend channel LTCUSD has the Fibonaccis where the first step is at the 61.8% Fibonacci-mark
it will be good to see how LTCUSD reacts in this mark and if it succeeds to take out this mark which will be bullish.
The RSI is sending some moderate signs which can confirm to the upside and touch the overbought region.
The MACD sending neutral signs at the moment and can confirm to the upside with a bullish cross.
TREND: Stabilized
FORMATION: Downward channel, Support range, Fibonacci structure
EXPECTATION: Confirmation above the downward channel
FULFILLMENT: Sooner or later
TREND AFTER EXPECTATION: Upside
PREV: 41.175
OPEN: 41.190
VOLUME: 11.305K
DAY’S RANGE: 41.033 — 42.049
Recent Posts
- Crypto News
Crypto ETF Issuer 21Shares Advances Dogecoin ETF Bid with Amended S-1 Filing
Crypto ETF issuer 21Shares has indicated it still intends to launch its Dogecoin ETF, as…
- Bitcoin News
Bitcoin Crash Risk Mounts As Peter Brandt Points to 80% Declines in Every Major Cycle
Veteran trader Peter Brandt has recently sparked a debate in the crypto market, predicting Bitcoin’s…
- Bitcoin News
Bitcoin Whale Doubles Down on BTC, ETH, SOL Short Positions, $243M at Stake
A Bitcoin whale has made a bold move, betting big on short positions in BTC,…
- Bitcoin News
IMF and El Salvador in Bitcoin Talks: Progress Made, Compliance Deadline Set
El Salvador is nearing a crucial milestone in its Bitcoin initiatives as the International Monetary…
- Crypto News
Trump Media Invests $40M in Bitcoin as Incoming CFTC Chair Signals Crypto Clarity Act Push in January
CFTC Chairman Michael Selig said Congress is poised to advance crypto market structure legislation. His…
- Crypto News
Aave DAO Saga Deepens as Alignment Proposal Moves to Snapshot; AAVE Price Down 7%
After a new governance alignment proposal was moved to a Snapshot vote, the Aave DAO…