3 Reasons Why Shiba Inu (SHIB) Price May Witness Massive Growth in 2023
Shiba Inu (SHIB) price downtrend started in November 2021 has shifted its direction sideways reflecting the exhaustion of bearish momentum. The formation of new higher lows in price reflects the buyer’s attempt to regain trend control and the possible bottoming of this memecoin.
In today’s chart analysis, we’ll discuss three reasons why the SHIB price may witness significant growth in the near future.
Also Read: Shiba Inu Unveils Timeline to Pre-Order its Cold Wallet, Here’s Impact on Price
1. Is Shiba Inu A Good Investment for Long-term?
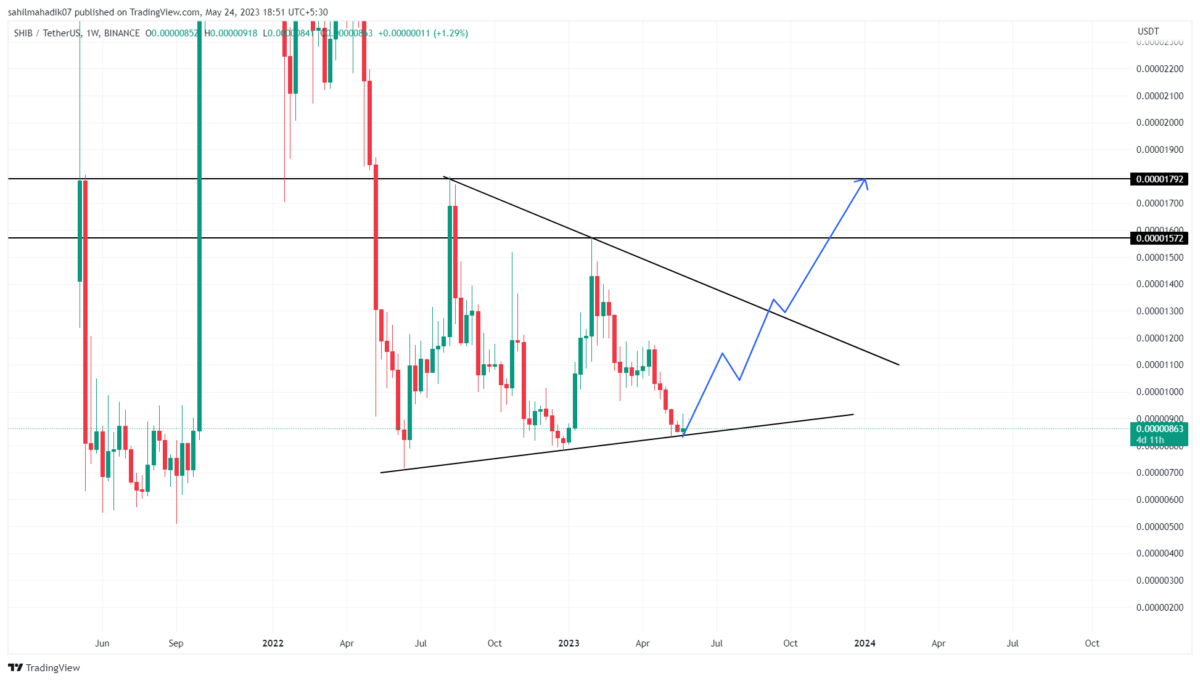
In the weekly time frame chart, the Shiba Inu price shows the formation of a symmetrical triangle pattern. For nearly a year, this memecoin has been resonating between the triangle’s converging trendlines giving a specific direction to the current sideways trend.
Amid the recent correction phase in the market, the SHIB price has plunged back to the pattern’s support in search of suitable support. In a favorable bullish scenario, the ascending trendline will recuperate the bullish momentum and drive a price swing back to the upper trendline, situated near $0.0000135.
2. SHIB Price Accumulation At Key Support
By the press time, Shiba Inu price trades at $0.00000865 and shows a short-term consolidation phase above the long-coming support trendline. The sideways move showcased several failed attempts from sellers to plunge the price lower which reflects aggressive accumulation from market participants.
This buying pressure could surge the price higher and a potential breakout from the $0.00000917 resistance will signal the start of a new bull cycle within the pattern.
3. RSI Turns Bullish on Weekly Chart
The Relative Strength Index(RSI) is a momentum indicator used to determine the strength of the recent movement of an asset. While the SHIB price still makes a series of lower highs, the weekly RSI slope shows an evident rise indicating increasing buying pressure amid a sideways trend.
This bullish divergence increases the possibility of a bullish reversal and upside breakout from the triangle pattern.
Will Shiba Inu Price Break $0.0000135 Mark Soon?
Recent Posts
- Price Analysis
XRP, Bitcoin, Ethereum Price Predictions Ahead of Jan 2026 CLARITY Act and US Crypto Reserve Plans
The XRP, Bitcoin, and Ethereum prices remained in a bear market after falling by over…
- Price Analysis
Pi Network Analysis: Pi Coin Price Surges on Christmas Eve, Can It Hit Year-End Highs?
Pi coin price reflect cautious positioning as market structure tightens near a key base. The…
- Price Analysis
Why Dec 26th Is A Do Or Die for Bitcoin Price Ahead Of Record Options Expiry?
As Christmas winds down, the Bitcoin price dipped 0.74% to around $86,750. Market participants…
- Price Analysis
Why Bitcoin, Ethereum And XRP Prices Are Down Today? (24 Dec)
The crypto market extended losses ahead of Christmas as Bitcoin, Ethereum, and XRP slipped further…
- Price Analysis
XRP Price Prediction: Will 4 Billion Transactions Spark Next Rally?
XRP price trades below the $2 mark after the latest correction across the broader cryptocurrency…
- Price Analysis
Solana Price Outlook: Will SOL Recover With Strong Institutional Buying?
Solana price remains steady above the $120 support after the recent crypto market pullback. The…