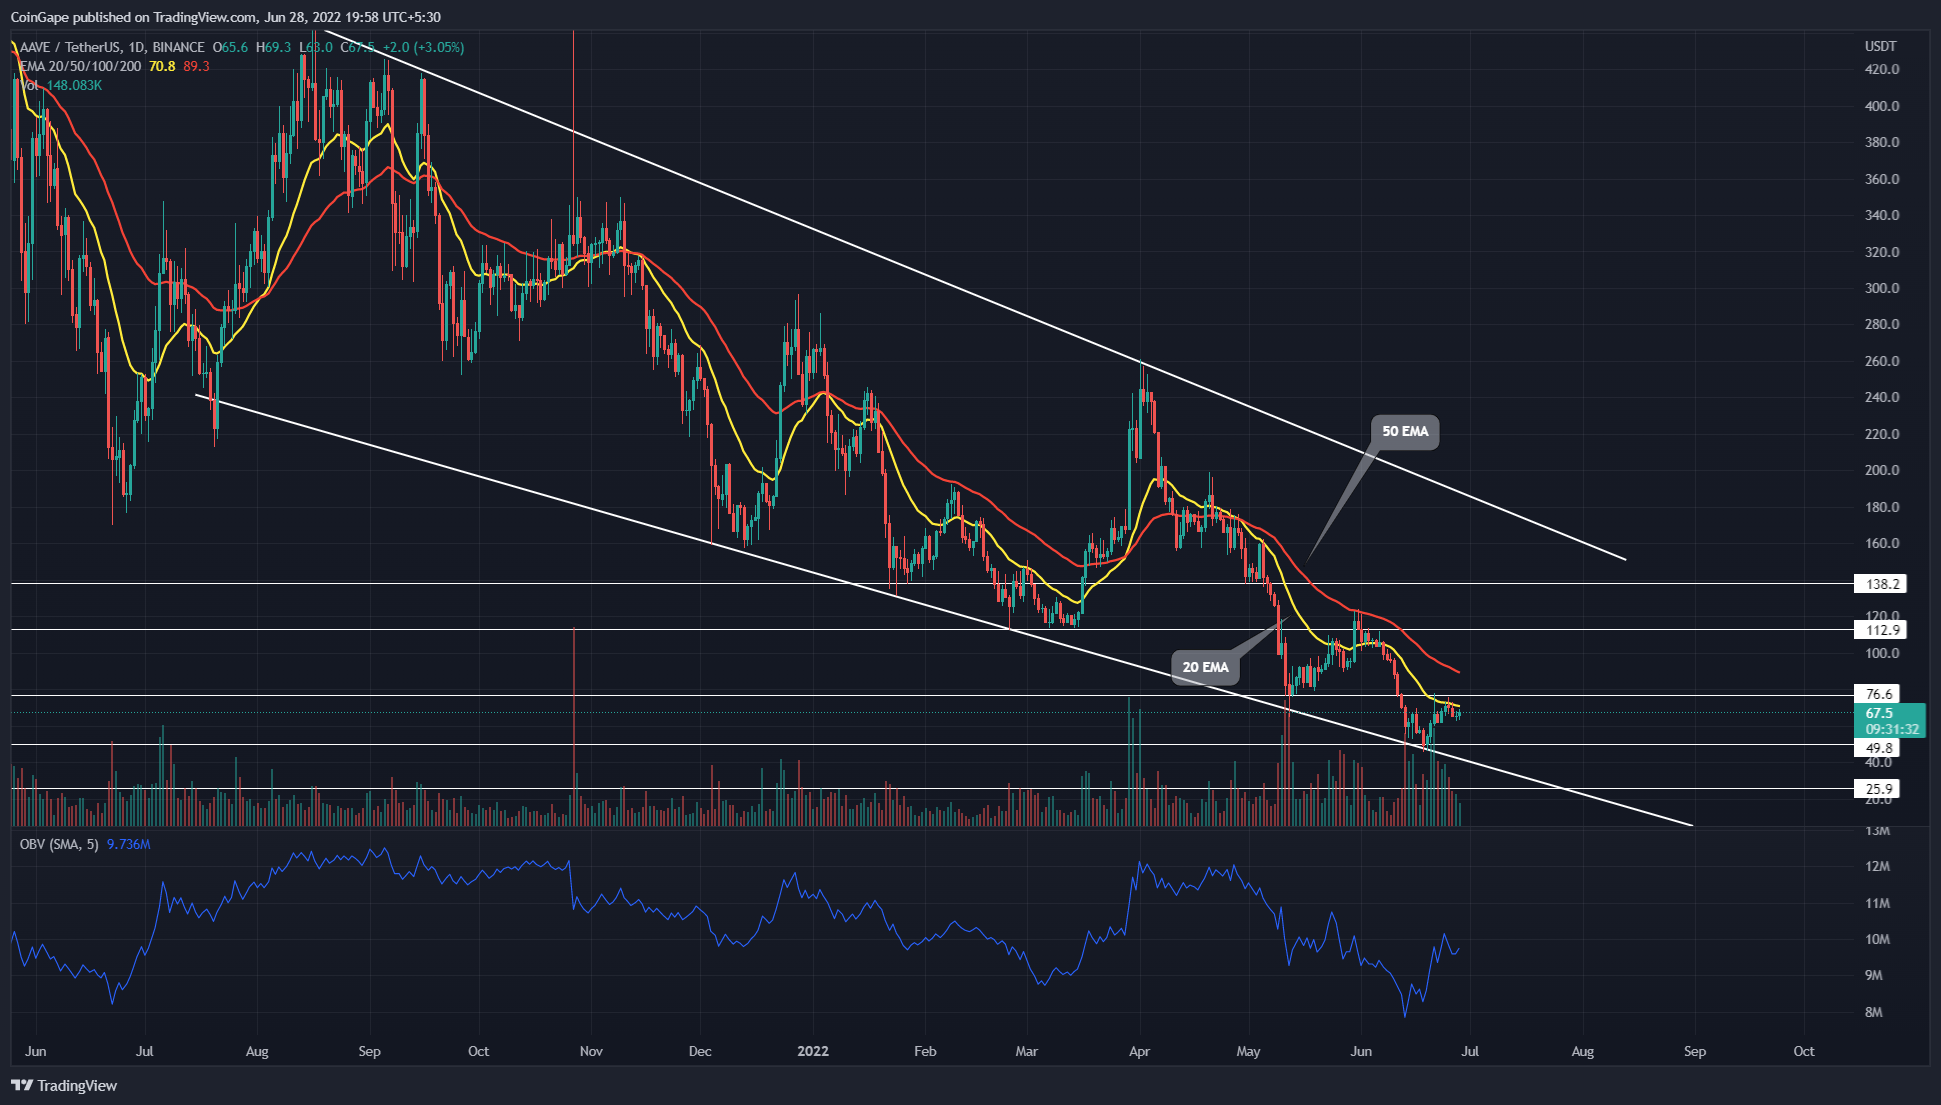
AAVE Price Analysis: Buyers Need $76.6 Breakout to Trigger Bullish Recovery


The AAVE price has been resonating in a falling channel pattern for nearly a year now. Historically, when the coin price has fallen to the bottom support trendline, the coin chart displays a recovery rally of more than 50% or more till it reaches the overhead trendline. Thus, the altcoin has again reverted from the support trendline, indicating a recovery opportunity for traders.
Key points:
- The rising OBV indicator slope encourages coin buyers to breach the $76.6 resistance.
- The $76.6 breakout may drive the AAVE price 46% higher to the $112 mark.
- The intraday trading volume in AAVE/USD is $134.3 Million, indicating a 15% gain.
 Source- Tradingview
A falling parallel channel pattern reflects the AAVE/USDT pair downtrend since mid-August 2021. Moreover, the coin price has retested on the descending trendlines multiple times, validating the pattern is active and could affect the upcoming rally.
Amid the June second-week sell-off, the AAVE price plummeted to the combined support of a descending trendline and $50. While the crypto market witnessed a widespread recovery last week, the altcoin surged 54.8% higher and hit the $76.6 resistance.
However, over the past eight days, the AAVE chart shows several long-wick rejection candles at overhead resistance, suggesting the sellers are aggressively defending this level. Thus, if the altcoin continues to sustain below this resistance, the sellers may pull the price 28% lower to the 50-$48 support zone.
Conversely, a possible breakout from the $76.6 resistance could trigger another bull cycle within the falling channel. The resulting recovery could rise to overhead resistance.
Technical indicator
The OBV indicator showed exceptional growth in response to the recent price jump, bolstering the breakout theory from the $76.6
However, since the April-May sell-off, the AAVE price has experienced dynamic resistance from the 20-and-50-day EMAs. Currently, the 20 EMA aligned with the $76.6 chart level puts additional selling pressure on coin traders.
- Resistance levels: $76.6 and $11
- Support levels: $50 and $26

Why Trust CoinGape
CoinGape has covered the cryptocurrency industry since 2017, aiming to provide informative insights Read more…to our readers. Our journal analysts bring years of experience in market analysis and blockchain technology to ensure factual accuracy and balanced reporting. By following our Editorial Policy, our writers verify every source, fact-check each story, rely on reputable sources, and attribute quotes and media correctly. We also follow a rigorous Review Methodology when evaluating exchanges and tools. From emerging blockchain projects and coin launches to industry events and technical developments, we cover all facets of the digital asset space with unwavering commitment to timely, relevant information.
Related Articles

- Will Bitcoin Crash Again as ‘Trump Insider’ Whale Dumps 6,599 BTC
- XRP News: Ripple’s RLUSD Gets Boost as CFTC Expands Approved Tokenized Collateral
- Crypto Markets Brace as Another Partial U.S. Government Shutdown Looms Next Week
- $40B Bitcoin Airdrop Error: Bithumb to Reimburse Customer Losses After BTC Crash To $55k
- ETH Price Fears Major Crash As Trend Research Deposits $1.8B Ethereum to Binance
- Cardano Price Prediction as Midnight Token Soars 15%
- Bitcoin and XRP Price Outlook Ahead of Crypto Market Bill Nearing Key Phase on Feb 10th
- Bitcoin Price Prediction as Funding Rate Tumbles Ahead of $2.1B Options Expiry
- Ethereum Price Outlook as Vitalik Buterin Sells $14 Million Worth of ETH: What’s Next for Ether?
- Solana Price at Risk of Crashing Below $50 as Crypto Fear and Greed Index Plunges to 5
- Pi Network Price Prediction Ahead of PI KYC Validator Reward System Launch


