ADA Price Prediction: Bearish Pennant Points to 14% Downside Risk


The Cardano coin has been a steep correction for over a month now and marked a recent low at $0.29. Starting from the July 14th high of $0.379, this altcoin lost a market value of 37% and evaporated the entire gain of June. However, the daily chart shows the falling price turned sideways after obtaining support at $0.29 and showcased the formation of a bearish pennant pattern. Here’s how this chart setup could influence the ADA price in the near future.
Also Read: Cardano Debuts New Hydra Version, ADA Price Pump Incoming?
Cardano Daily Chart: Key Points
- The formation of a pennant pattern indicates a minor break period before the prevailing trend continues
- A bearish breakdown from the lower trendline may tumble the ADA price for a 14% drop
- The intraday trading volume in the ADA coin is $8.2 Billion, indicating a 57% gain.
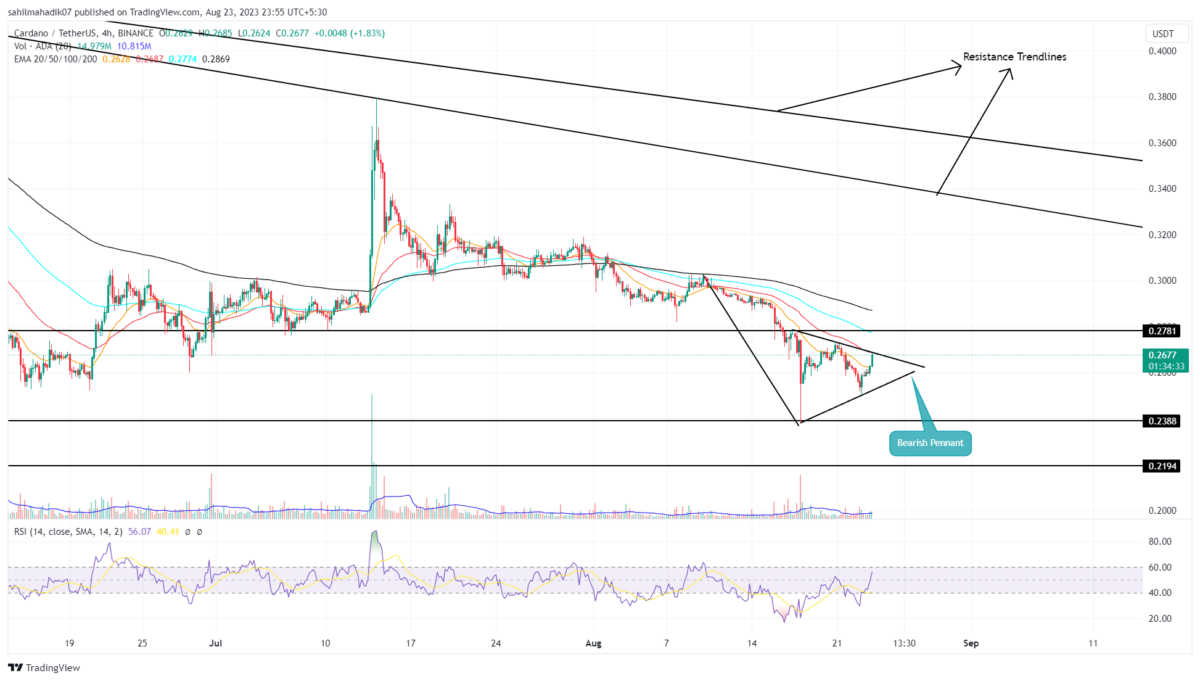
 Source- Tradingview
After the sharp sell-off on August 17th, the ADA price witnessed demand pressure near $0.29 and went sideways. This consolidation spread in a narrow range reflects uncertainty in the market sentiment but with a closer look in the 4-hour chart, it forms a triangle of a pennant pattern.
This often appears in a downtrend and offers a short breather to recuperate bearish momentum and prolong the prior trend. Currently, the ADA price trades at $0.267 with an intraday of 3.44%. Until the two converging trend lines are intact, the coin price may continue its lateral walk and approach the triangle’s peak.
With a higher possibility, the Cardano coin should break the lower trendline which may intensify the selling momentum. The post-breakdown fall may plunge the prices 14.5% down to retest the June month low of $0.22.
Can Cardano Coin Reclaim $0.3 Mark?
While the market sentiment remains bearish for Cardano’s price, a breakout above the overhead trendline of the triangle structure could increase buying pressure. This breakout bolsters a minor upswing in the current downtrend and may push the prices 20% higher to hit $0.323.

Why Trust CoinGape
CoinGape has covered the cryptocurrency industry since 2017, aiming to provide informative insights Read more…to our readers. Our journal analysts bring years of experience in market analysis and blockchain technology to ensure factual accuracy and balanced reporting. By following our Editorial Policy, our writers verify every source, fact-check each story, rely on reputable sources, and attribute quotes and media correctly. We also follow a rigorous Review Methodology when evaluating exchanges and tools. From emerging blockchain projects and coin launches to industry events and technical developments, we cover all facets of the digital asset space with unwavering commitment to timely, relevant information.