ADA Price to Hit 0.22? Bearish Pennant Formation Signals a 15% Dip
In response to recent uncertainty in the crypto market, Cardano’s (ADA) daily chart shows a minor relief rally. This upward movement is driven by ascending trendlines, forming a bearish pennant. While the bullish sentiment aligned with Bitcoin ETF is feeding the crypto market has witnessed an aggressive downfall and bolstered a bearish breakdown of the afromention pattern. Should you sell on this?
Also Read: XRP And Cardano Records Buying Amid Largest Crypto Funds Outflow
Bearish Pattern Hints Extended Correction in ADA price
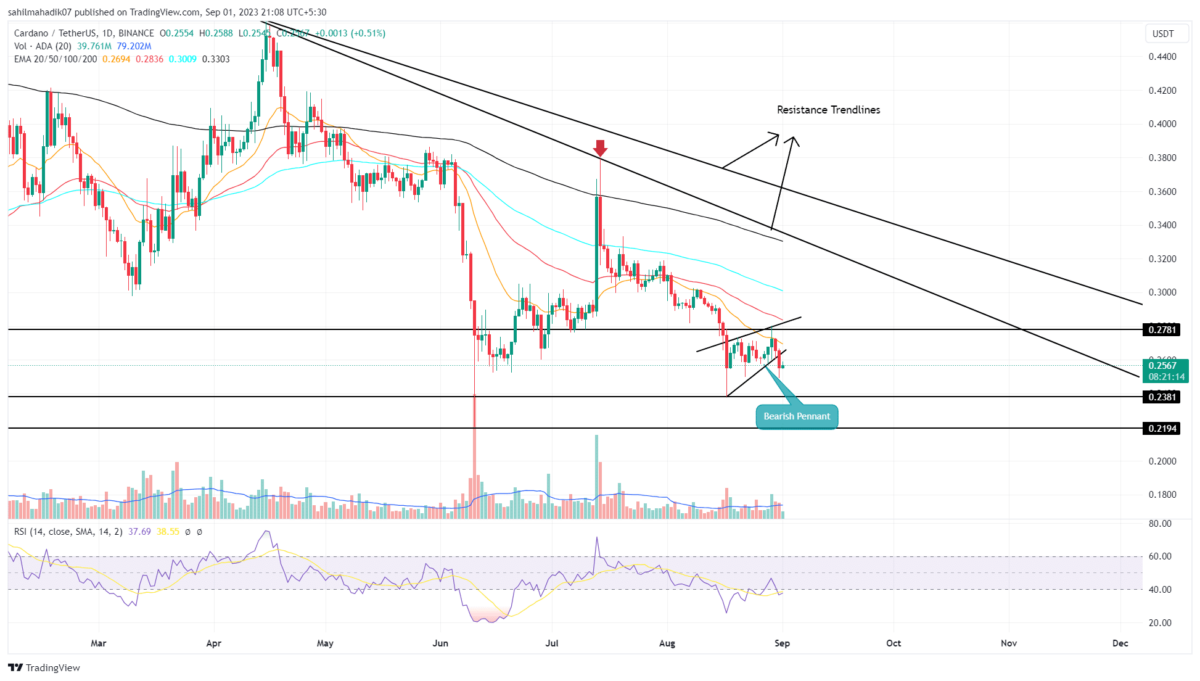
- Completion of bearish pennant pattern bolsters ADA price for 15% fall
- The coin buyers may experience demand pressure at $0.238 and $0.22 horizontal
- The intraday trading volume in the ADA coin is $207 Million, indicating a 14.2% gain
The bearish pennant pattern is often spotted in an established downtrend offering a brief break of sellers to replenish bearish momentum. With the continuation of selling sentiment in the market, the altcoin price gave a breakdown from the pattern support trendline on August 30th.
This breakdown signals for the continuation of a downward trend providing a short selling opportunity to market participants. With the intraday gain of 0.23%, the ADA showed a minor upswing to retest the flipped resistance.
Currently, the Cardano price trades at $0.258 with the current market cap at $9.06 Billion
If the coin price shows sustainability below the breached trendline, the prices may tumble the price 15% to hit $0.28 support followed by $0.22.
Will the Cardano Sideways Trend Continue?
While ADA price is currently declining, it’s worth noting that over the past week, its movement has been confined within the range defined by the August 17th candle, with a high of $0.278 and a low of $0.023. These levels now act as strong resistance and support. If the price falls to $0.238, the sellers may gain better confirmation for further downfall
However, if the demand pressure persists at this support, the sideways trend may extend longer
- Relative Strength Index: The RSI indicator slope falling below the 40% mark reflects strong bearish momentum.
- Exponential Moving Average: The ADA price witnessing a dynamic resistance from the 20-day EMA slope.
Recent Posts
- Price Analysis
SUI Price Forecast After Bitwise Filed for SUI ETF With U.S. SEC – Is $3 Next?
SUI price remains positioned at a critical intersection of regulatory positioning and technical structure. Recent…
- Price Analysis
Bitcoin Price Alarming Pattern Points to a Dip to $80k as $2.7b Options Expires Today
Bitcoin price rebounded by 3% today, Dec. 19, reaching a high of $87,960. This rise…
- Price Analysis
Dogecoin Price Prediction Points to $0.20 Rebound as Coinbase Launches Regulated DOGE Futures
Dogecoin price has gone back to the spotlight as it responds to the growing derivatives…
- Price Analysis
Pi Coin Price Prediction as Expert Warns Bitcoin May Hit $70k After BoJ Rate Hike
Pi Coin price rose by 1.05% today, Dec. 18, mirroring the performance of Bitcoin and…
- Price Analysis
Cardano Price Outlook: Will the NIGHT Token Demand Surge Trigger a Rebound?
Cardano price has entered a decisive phase as NIGHT token liquidity rotation intersects with structural…
- Price Analysis
Will Bitcoin Price Crash to $74K as Japan Eyes Rate Hike on December 19?
Bitcoin price continues to weaken after breaking below its recent consolidation range, now trading within…