Aptos Price Prediction as Buyers Break 200 Days Resistance; Will they Reclaim $8?
Contrary to the recent downturn in the crypto market, the APT price has witnessed a significant inflow since last weekend. The coin price rose for four consecutive days, has recorded a 12% gain, and challenges the long-coming price and timeline. A potential breakout from this barrier would be a key signal of sustained recovery.
Also Read: Central American Country Uses Bitcoin To Conduct Fair Election; Here’s How
Will its New Found Recovery Continue?
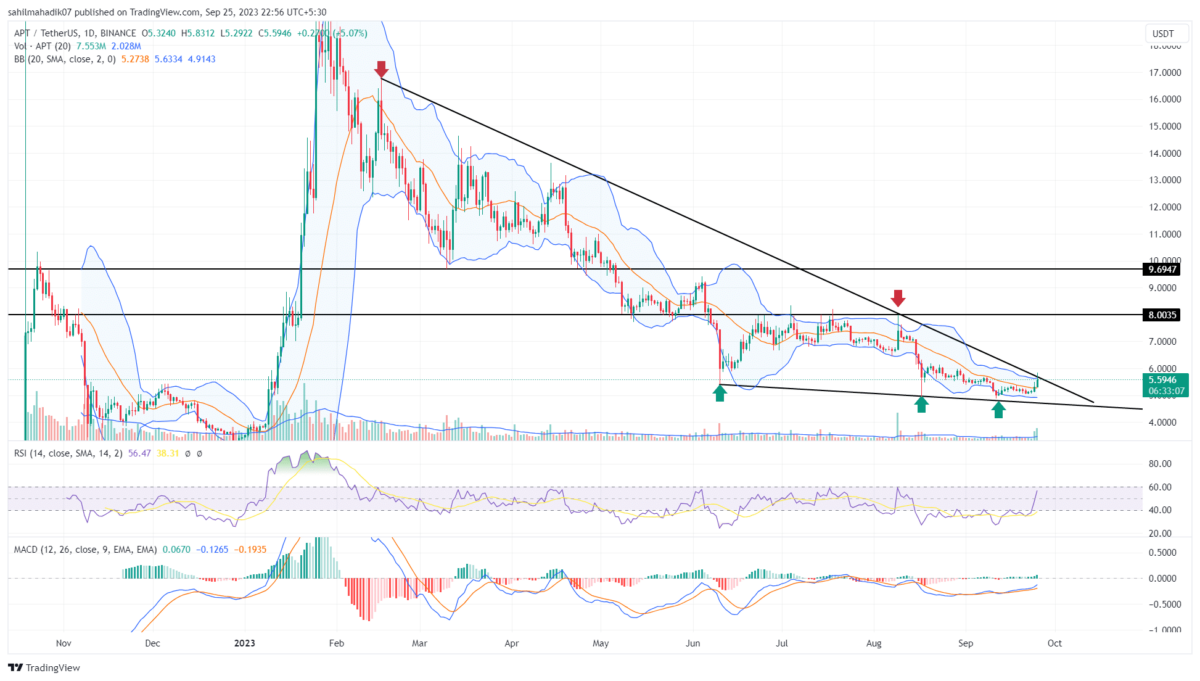
- The APT price faces dynamic resistance from a falling trendline.
- A potential bullish breakout from the overhead trendline will be an early sign of trend reversal
- The intraday trading volume in APTer is $343.2 Billion, indicating a 20% gain
Since February 2023, the Aptos coin price has experienced a significant correction, registering a 73% loss from its all-time high of $19.9. However, the daily chart shows the coin price has started molding between converging trend lines, acting as dynamic resistance and support.
With the recent uptick in APT price, the buyers knock on the door of the upper trendline—a barrier that’s held firm for nearly 200 days. However, the visible price rejection on the day’s candle might indicate that sellers are still guarding this fortress. If they maintain their stance, this altcoin might retract and trigger a new bear cycle within the wedge formation of trendlines.
The potential decline may plunge the prices 18% down to hit the lower trendline.
Will Aptos Rise to $8?
Until the two trendlines are intact, the Aptos coin rise may continue their ongoing downtrend. However, the converging nature of this trend line would eventually lead to a decisive breakout. If we lean on the side of optimism, a bullish breakout from the upper trend line could pave the way for buyers to regain control, ushering in a fresh rally. The post-breakout rally could surge the price of the $8 psychological barrier.
- Bollinger Band: The narrow range of Bollinger Band indicates increasing volatility and an imminent breakout is close.
- Moving Average Convergence Divergence: A potential crossover of the MACD(Blue) and signal lines(orange) above the midline could bolster the buying pressure.
- Relative Strength Index: The daily RSI slope rising above 50% reflects the increasing bullish momentum among traders.
Recent Posts
- Price Analysis
Shiba Inu Price Eyes a 45% Rebound as Burn Rate Spikes 10,700%
Shiba Inu price continued its freefall and is now hovering at its lowest level since…
- Price Analysis
Expert Predicts Ethereum Price Rebound to $4k as BitMine, Long-Term Holders Buy
Ethereum price rose by 1.5% today and moved slightly above the important resistance level at…
- Price Analysis
Bitcoin Price Prediction Ahead of FOMC Minutes
Bitcoin price continues trading within a tightening range, with BTC price holding between $88,000 and…
- Price Analysis
U.S. Government Shutdown Looms: These 3 Crypto Predictions Could Explode
As the January trading session unfolds, the crypto market rose 1.07% in 24 hours, showing…
- Price Analysis
Grayscale Files for First U.S. Bittensor ETF: Will TAO Price Rally to $300 in January?
Bittensor (TAO) price climbed above $220 in the last 24 hours after Grayscale filed for…
- Price Analysis
Shiba Inu Price Prediction: Will SHIB Show Golden Cross Signal in 2026?
Discussion around a potential Golden Cross in 2026 has intensified as Shina Inu price compresses…