Avalanche Price Analysis: AVAX Faces 15% Downside Risk Below This Level


Avalanche price analysis indicates a bearish sentiment for the day. The price is oscillating near the $22.20 horizontal support level. Traders must cautiously trade around this resistance-turned support zone.
All overlook is favoring bears, however, it is prudent to look for any reversal before placing any aggressive bids.
- Avalanche price trades modestly lower as the weekend begins.
- A decisive break below $22.20 would bring more losses to the coin.
- However, a daily candlestick above $25.00 would invalidate any bearish theory.
As of press time, AVAX/USD is reading at $22.63, down 3.12% for the day. The 15th largest cryptocurrency by the market cap holds the 24-hour trading volume at $2.94 billion with more than 21$ in losses.
Avalanche price looks for downside move
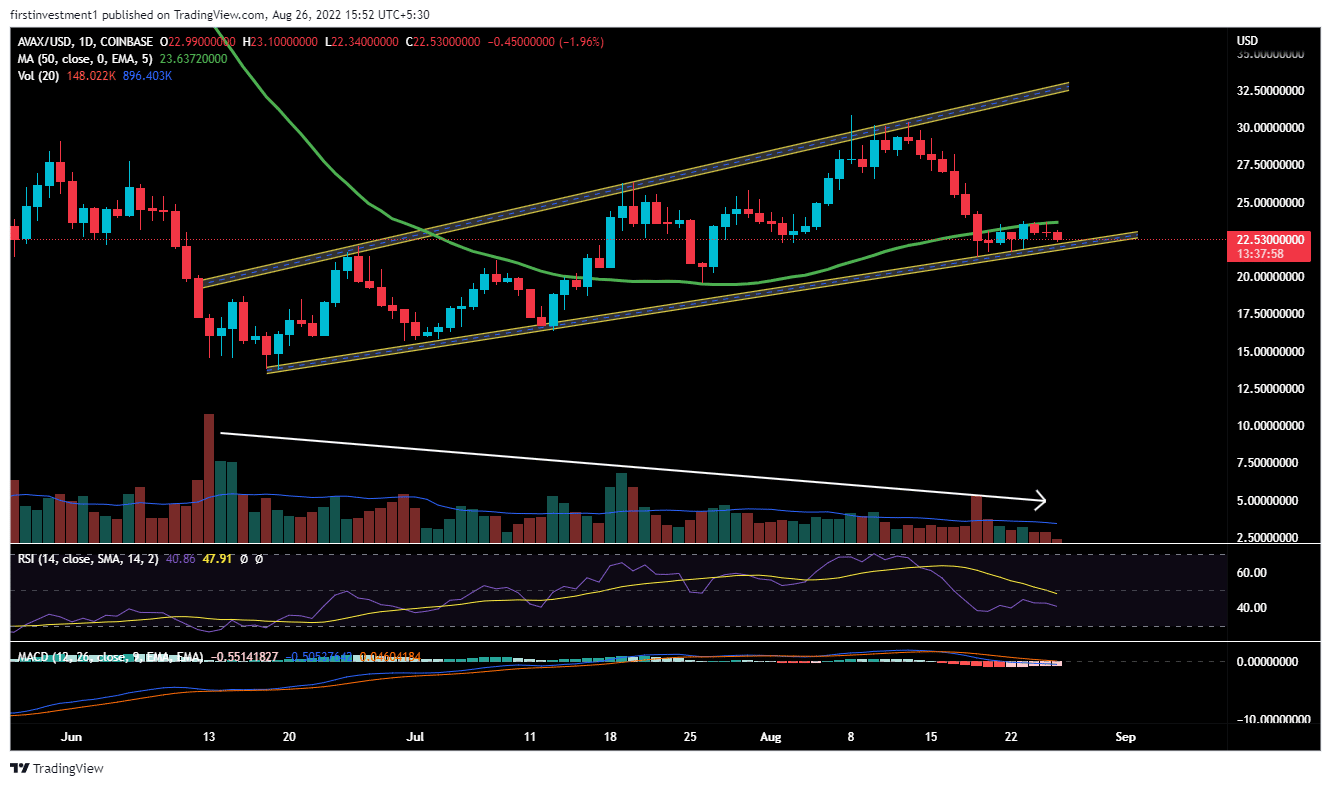
On the daily chart, AVAX is trading in a “Rising Channel” pattern, forming higher highs and lows.
Currently, the price is trading near the support level of the channel. AVAX took a deep dive from its swing high to its recent lows with a more than 30% fall, between August 13 to August 19.
Further, The asset broke the critical 50-day exponential moving average but takes the support of the channel’s demand zone. Thus, the Avalanche price analysis warns traders of aggressive bids.
So far, the price has been consolidating near its support zone for the last seven days, with a declining volume.
The volumes are below the average line and falling, with the price moving sideways, implying distribution near support. Big money is slowly entering a short trade. If the price closes below the low of the August 19 candle ($21.38), along with a breakdown of the rising channel demand zone. then we can expect a price to go below $20.00 followed by $18.50.
The RSI(14) is trading below 50. When the relative strength index is below 50, it generally means that the losses are greater than the gains. Whereas, the MACD line crosses below the signal line below zero, indicating a bearish trend.
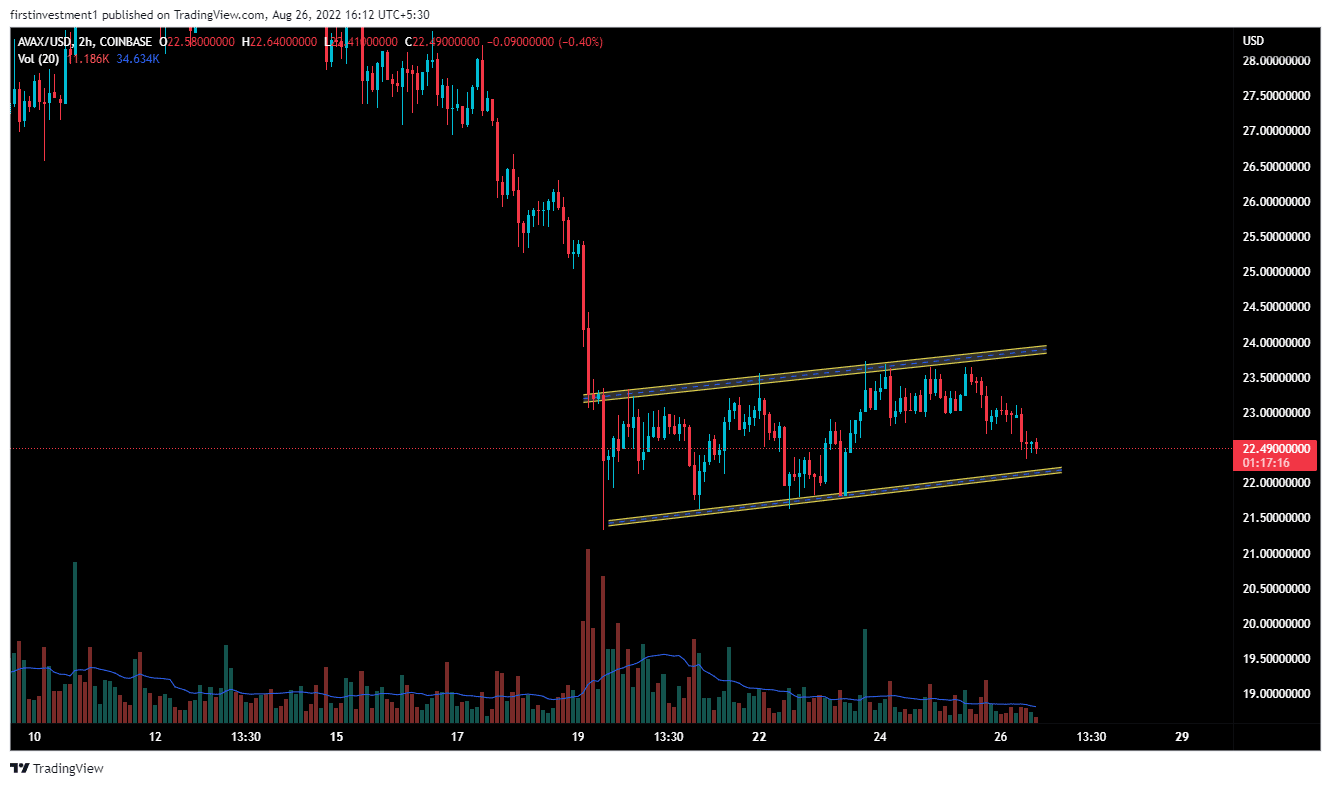
On the hourly time frame, forming a bearish “Flag & pole” pattern, & is trading near the support level. If the price ($22.00) breaks below this pattern, then we can expect a very good sell-off.
The nearest support of AVAX is $22.00, whereas the nearest resistance is $23.65. There is a higher probability of the price breaking down its support level and going down much further.
Also read: https://The Next Bull Or Bear Crypto Market Will Be Decided Today, Here’s Why
On the other hand, a sustained buying pressure above the $23.00level could invalidate the bearish outlook. And the price can move toward $25.00.
AVAX looks bearish on all time frames. Below $20.00 closing on the daily time frame, we can put a trade on the sell side.
Why Trust CoinGape
CoinGape has covered the cryptocurrency industry since 2017, aiming to provide informative insights Read more…to our readers. Our journal analysts bring years of experience in market analysis and blockchain technology to ensure factual accuracy and balanced reporting. By following our Editorial Policy, our writers verify every source, fact-check each story, rely on reputable sources, and attribute quotes and media correctly. We also follow a rigorous Review Methodology when evaluating exchanges and tools. From emerging blockchain projects and coin launches to industry events and technical developments, we cover all facets of the digital asset space with unwavering commitment to timely, relevant information.
Related Articles


- Peter Brandt Predicts Deeper Ethereum Price Crash, Vitalik Buterin Withdraws 16,384 ETH
- Coinbase Exchange Review 2026 – A Deep Dive into Fees, Features and Security
- Crypto Traders Brace for $8.5B in Bitcoin and Ethereum Options Expiry Today
- Bitcoin Drops to Two-Month Low as Crypto Market Braces for Trump Executive Order
- Binance to Move $1B SAFU Fund Into Bitcoin Reserve Despite BTC Price Dip
- Bitcoin Price Prediction as Trump Names the Next Fed Chair Today
- XRP Price Outlook Ahead of Possible Government Shutdown
- Ethereum and XRP Price Prediction as Odds of Trump Attack on Iran Rise
- Gold and S&P 500 Price Prediction as BTC $88K Sparks Global Risk-On Rally
- How High Can Hyperliquid Price Go in Feb 2026?
- Top Meme Coins Price Prediction: Dogecoin, Shiba Inu, Pepe, and Pump. Fun as Crypto Market Recovers.


