Axie Infinity (AXS) Price Analysis: Falling Channel Pattern Extends Correction Phase for AXS Price; Buy, Hold Or Sell?


A falling parallel channel pattern is leading the correction rally in the Axie Infinity (AXS) price. Though this falling pattern is now stretching the down rally, a bullish breakout from its resistance trendline could begin a new rally in the AXS coin. The coin price currently trading at $77.4 has so far discounted by 53% from the All-Time High of $164.
Key technical points:
- The AXS price could retest 200 MA line as resistance
- The 4-hour-MACD indicator shows a bearish crossover among the MACD and signal line
- The intraday trading volume in the AXS token is $469.3 Million, indicating a 4% fall.
 Source- Tradingview
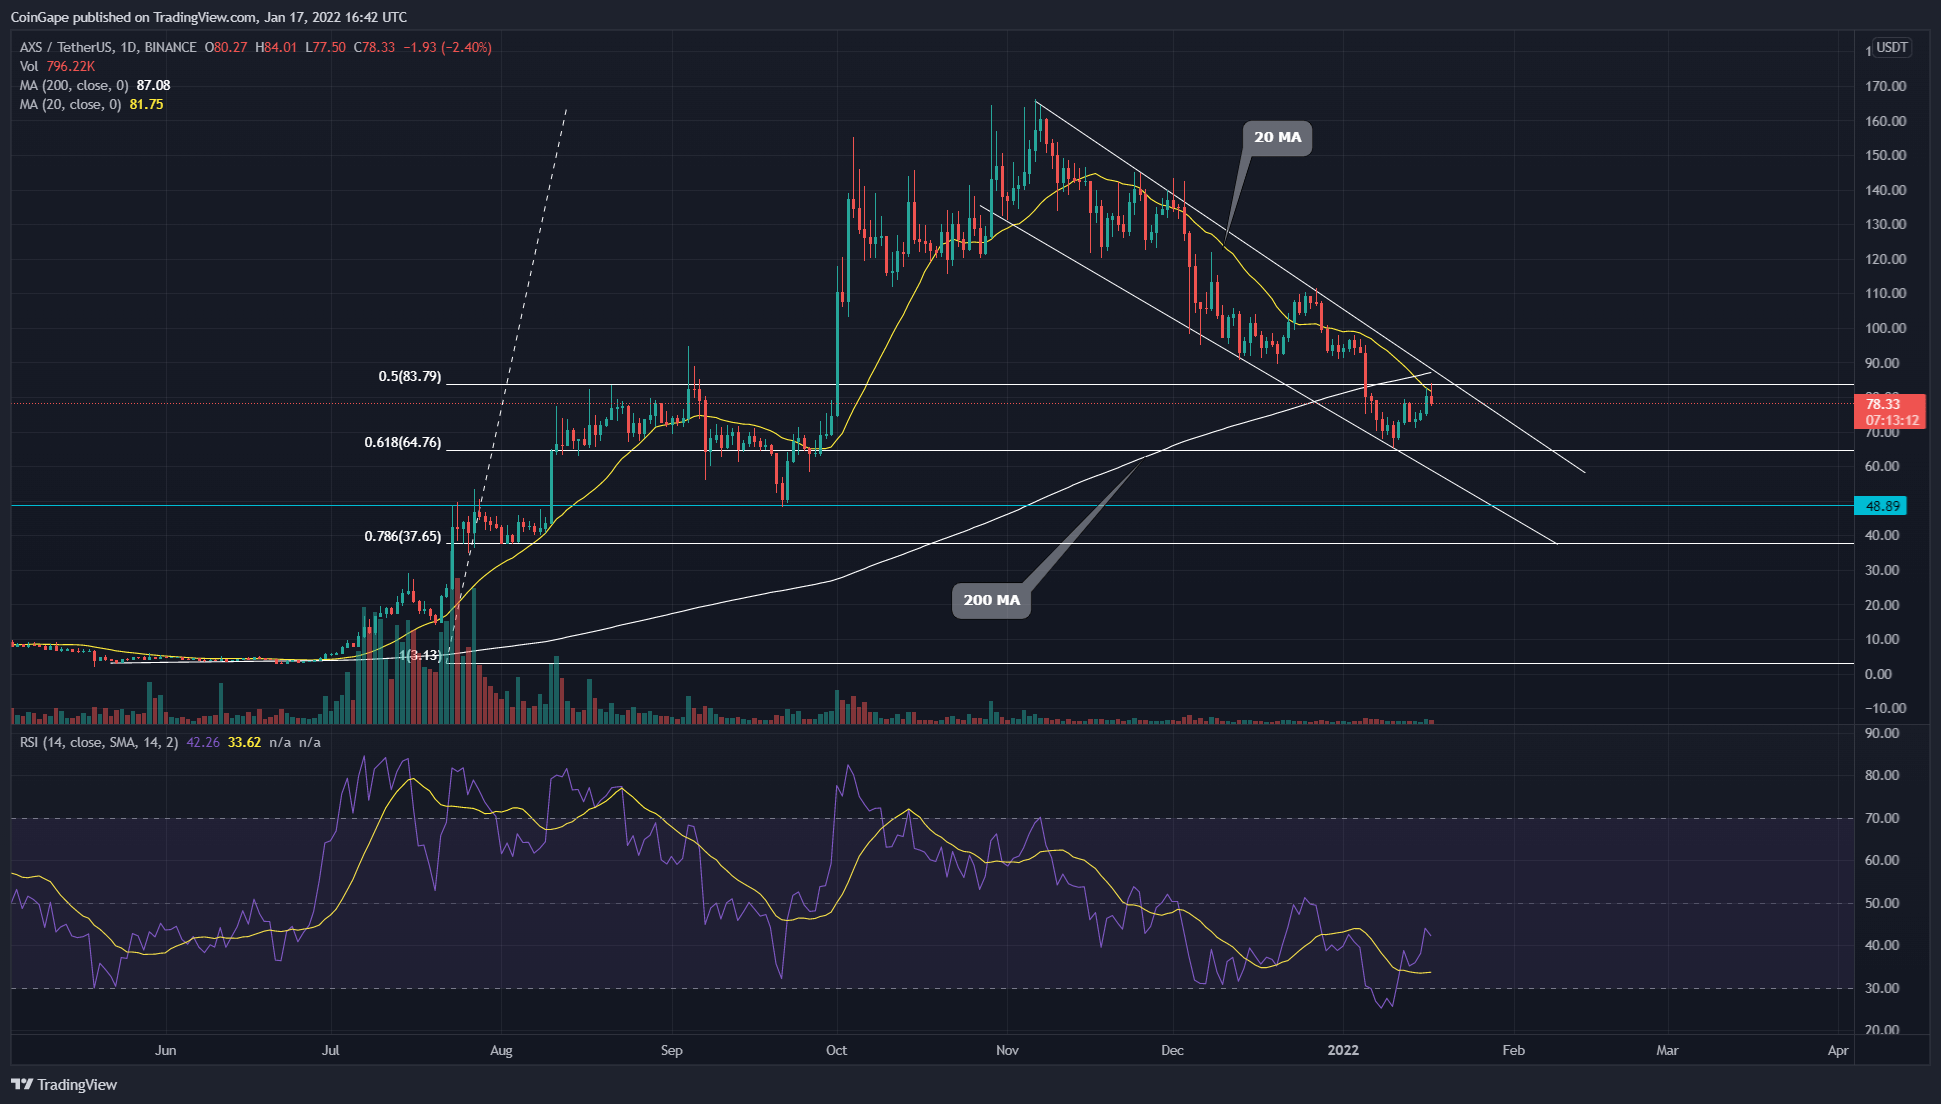
The AXS price initiated a correction rally after rejecting from the $160 resistance level. The technical chart shows a steady downtrend with a lower high and lower low, resonating inside a falling parallel channel pattern.
Until this pattern is intact, the coin price will continue the downtrend and drop to even lower levels. On a contrary note, falling channel patterns are known to begin a strong bullish rally once the price breaks out from its dynamic resistance.
However, the AXS price has recently plunged below the 200 MA line, and the price action shows a bullish reversal might retest this MA line in search of sufficient supply.
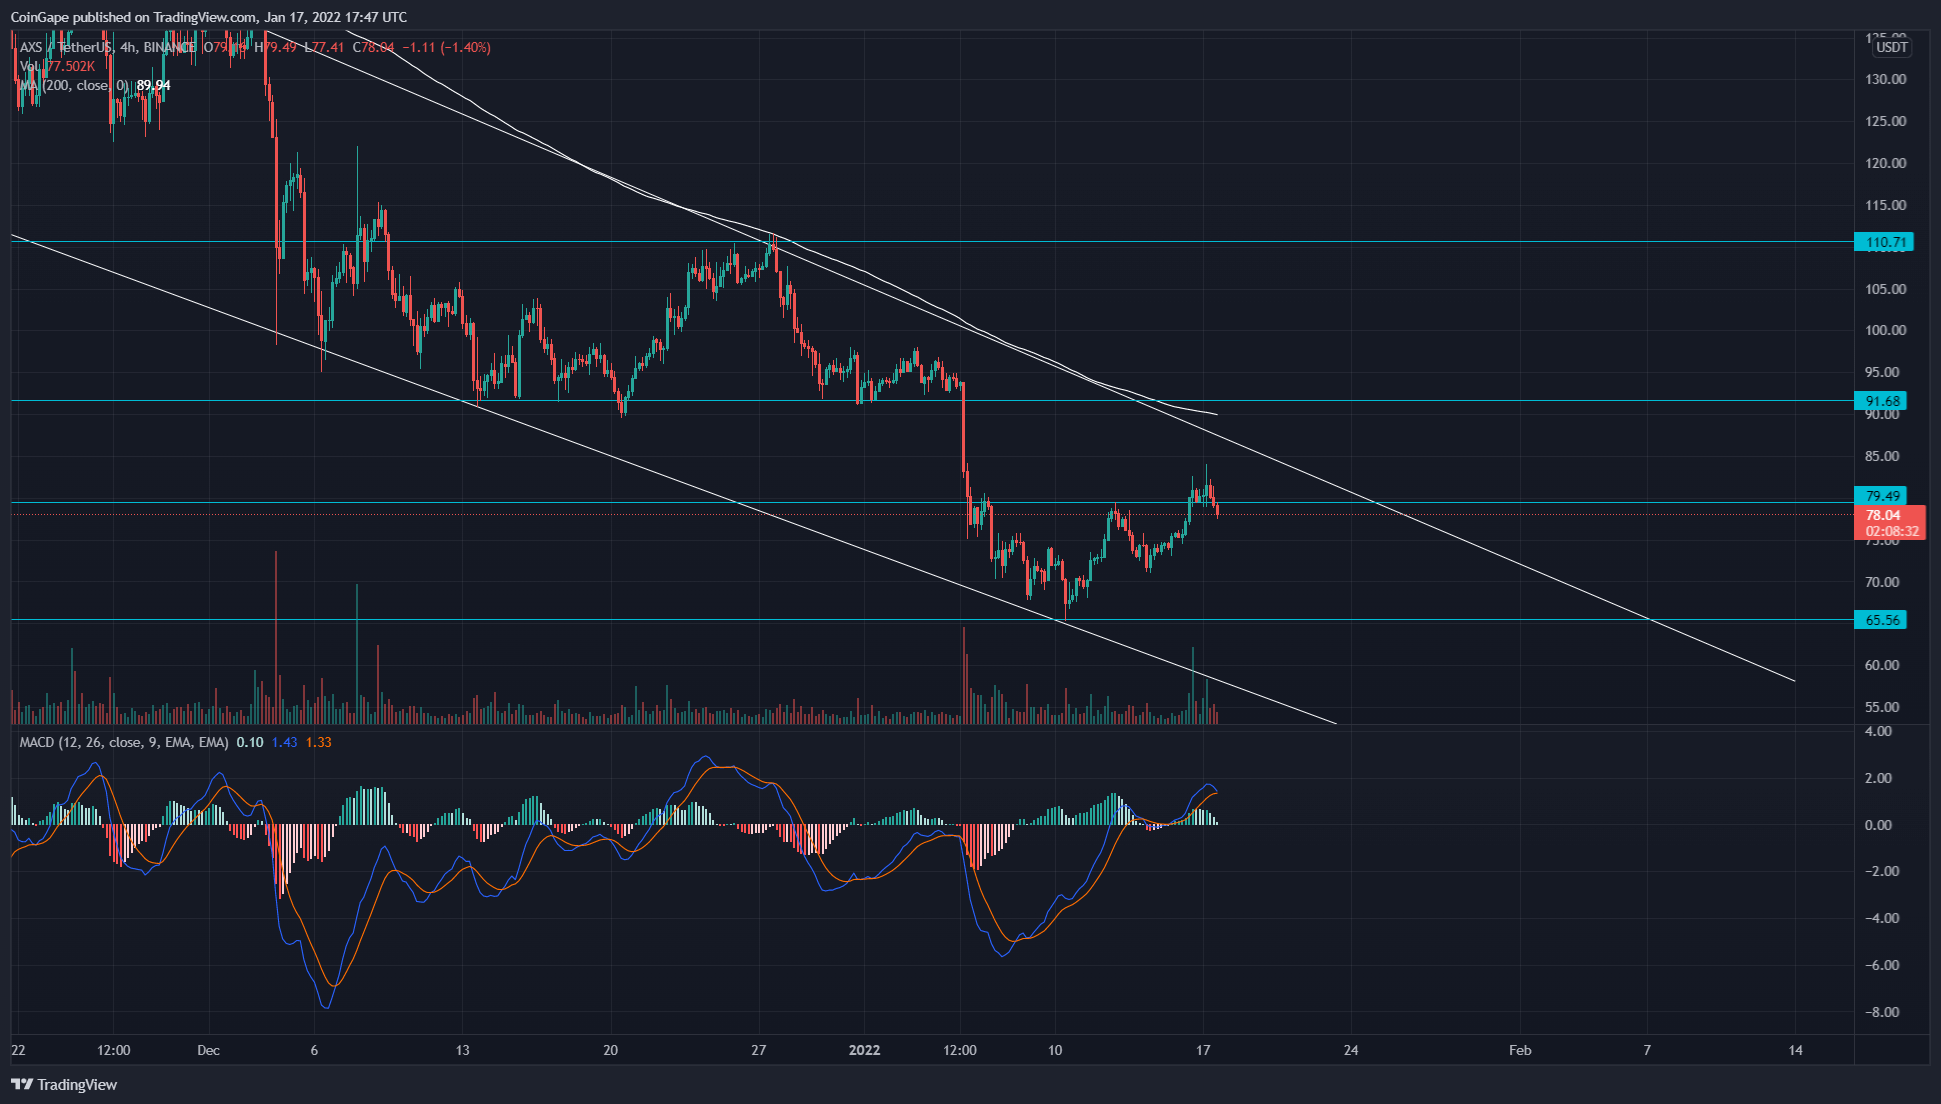
AXS Price Analysis: 4-hr Chart
 Source-Tradingview
From the new lower low of $65.3, The AXS price has pumped 20% in just one week. The price is currently approaching the overhead resistance of the falling channel. The crypto traders should closely watch the price action at this resistance as a rejection or breakout from this pattern could extend or end the correction phase respectively.
The Moving average convergence divergence indicator shows the MACD and signals moving above the neutral, suggesting a bullish sentiment. However, a bearish crossover among these lines and the diminishing green faded bars in the histogram chart hints buyers are gradually losing momentum.
The technical chart suggests the important resistance levels for AXS price is at $79.5, followed by $91.2. Meanwhile, the support levels are $65.5 and $49.
Why Trust CoinGape
CoinGape has covered the cryptocurrency industry since 2017, aiming to provide informative insights Read more…to our readers. Our journal analysts bring years of experience in market analysis and blockchain technology to ensure factual accuracy and balanced reporting. By following our Editorial Policy, our writers verify every source, fact-check each story, rely on reputable sources, and attribute quotes and media correctly. We also follow a rigorous Review Methodology when evaluating exchanges and tools. From emerging blockchain projects and coin launches to industry events and technical developments, we cover all facets of the digital asset space with unwavering commitment to timely, relevant information.
Related Articles


- New $2M Funding Reveals Ethereum Foundation’s New Threat
- U.S. Shutdown Odds Hit 78% as CLARITY Act Faces Fresh Uncertainty
- Bitcoin Sentiment Weakens BTC ETFs Lose $103M- Is A Crash Imminent?
- Trump Backed Rick Rieder Now Leads the Odds for New Fed Chair
- Trump Threatens 100% Canada Tariffs as Bitcoin Holds $89K
- PEPE vs PENGUIN: Can Pengu Price Outperform Pepe Coin in 2026?
- Binance Coin Price Outlook As Grayscale Files S-1 for BNB
- Solana Price Prediction as SOL ETF Inflows Outpace BTC and ETH Together
- Bitcoin and Gold Outlook 2026: Warsh, Rieder Gain Traction in Trump’s Fed Pick
- PEPE Coin Price Eyes 45% Rebound as Buyers Regain Control on Spot Markets
- Pi Network Price Prediction: Will PI Coin Hold Steady at $0.18 Retrace Lower?


