Bearish Pattern Emerged In Chainlink Chart Tease A Revisit To $5.8 Mark


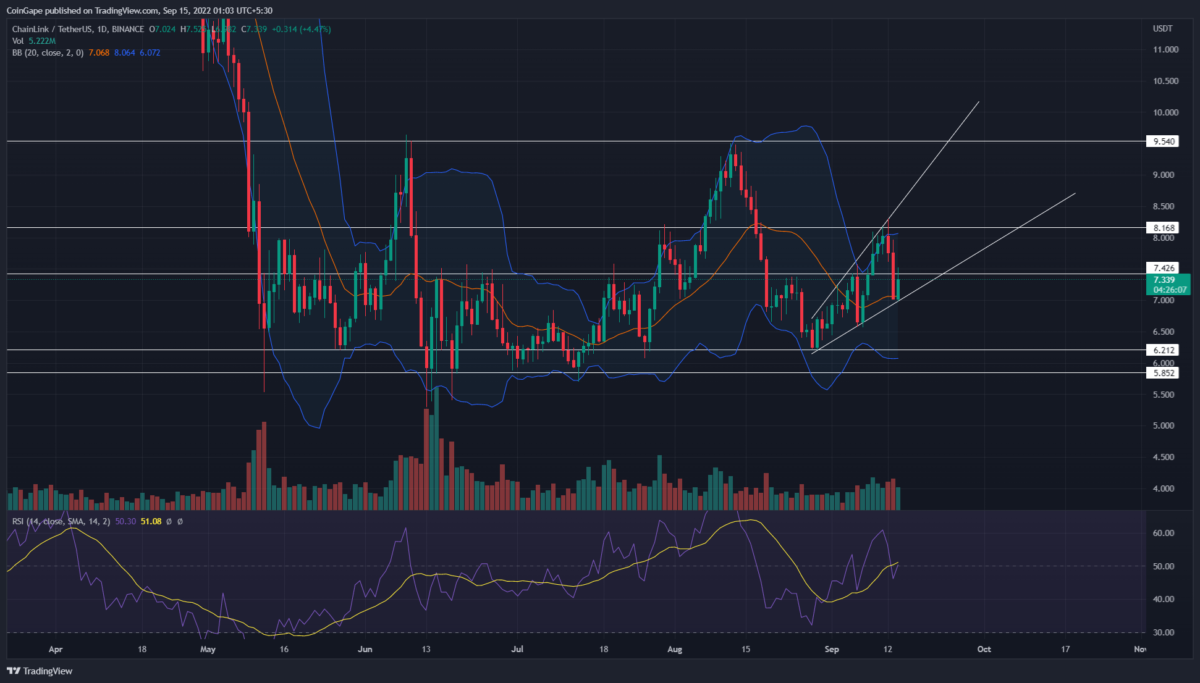
The daily technical chart shows the Chainlink price has followed a range-bound rally for the past four weeks. Several times, the coin price has retested both the upper($9.54) and lower($6.2-$5.8) barriers, validating them as areas of high interest. The ongoing recovery within the pattern aims for the upper barrier mentioned above.
Key points from Chainlink analysis
- A broadening channel pattern maintains the current recovery in chainlink price,
- The crucial EMAs(20, 50, and 100) accentuate a sideways ally
- The intraday trading volume in the LINK coin is $512.8 Billion, indicating a 7.3% loss.
 Source- Tradingview
A new bull cycle within this range was initiated on August 29th, when the Chainlink coin price rebounded from the $6.2 support with a bullish engulfing candle. The bull-run accounted for a 32.8% rally, which marked a high of $8.3.
However, the chainlink price shows a sharp reversal from this level as the crypto market witnessed a sudden sell-off. The downfall was caused when the recent CPI rate data pointed to 8.1% Y-o-Y inflation.
Furthermore, it seems the ongoing recovery in Chainlink coin price is responding to a broadening channel pattern. Thus, the pattern’s support trendline stalled the falling price at $7 and reverted it higher by 4.8%.
The altcoin currently trades at the $7.34 mark, and under the influence of this pattern, it could rise even to the top resistance of $9.5. However, the very nature of this pattern is bearish, and therefore, a breakdown from its support trendline will trigger a significant correction.
Thus, the trendline breakdown will accelerate the bearish momentum and plummet the prices to $6.2-$5.8 bottom support.
However, concerning the bigger picture, the chainlink coin will remain sideways until prices don’t breach the $9.5 or $5.8 barrier.
Technical Indicator
RSI indicator: the daily-RSI slope attempt to re-enter the bullish territory indicates the market participant still keeps hopes from Chainlink price
Bollinger band indicator: the coin price trading above the midline reflects the current market value is higher than the mean value from the ongoing price range.
- Resistance levels- $7.42, and $8.16
- Support levels- $6.6 and $6.2-$5.8

Why Trust CoinGape
CoinGape has covered the cryptocurrency industry since 2017, aiming to provide informative insights Read more…to our readers. Our journal analysts bring years of experience in market analysis and blockchain technology to ensure factual accuracy and balanced reporting. By following our Editorial Policy, our writers verify every source, fact-check each story, rely on reputable sources, and attribute quotes and media correctly. We also follow a rigorous Review Methodology when evaluating exchanges and tools. From emerging blockchain projects and coin launches to industry events and technical developments, we cover all facets of the digital asset space with unwavering commitment to timely, relevant information.

Related Articles


- Shark Tank Kevin O’Leary Warns Bitcoin Crash as Quantum Computing Threats Turns Institutions Cautious
- Japan’s SBI Clears XRP Rumors, Says $4B Stake Is in Ripple Labs Not Tokens
- 63% of Tokenized U.S. Treasuries Now Issued on XRP Ledger: Report
- Will Bitcoin & Gold Fall Today as Trump Issues Warning to Iran Before Key Nuclear Talks?
- Crypto Ties Revealed in Epstein Files: 2018 Emails Point to Gary Gensler Discussions
- Dogecoin, Shiba Inu, Pepe Coin Price Predictions As BTC Crashes Below $68k
- Ethereum Price Outlook as Harvard Shifts Focus from Bitcoin to ETH ETF
- HOOD and COIN Stock Price Forecast as Expert Predicts Bitcoin Price Crash to $10k
- XRP Price Prediction Ahead of Supreme Court Trump Tariff Ruling
- Crypto Price Prediction For This Week: Dogecoin, Solana and Cardano
- Bitcoin Price Prediction: How Could Brazil’s Strategic Bitcoin Reserve Proposal Impact BTC?


