Bearish Pattern Emerged In Chainlink Chart Tease A Revisit To $5.8 Mark
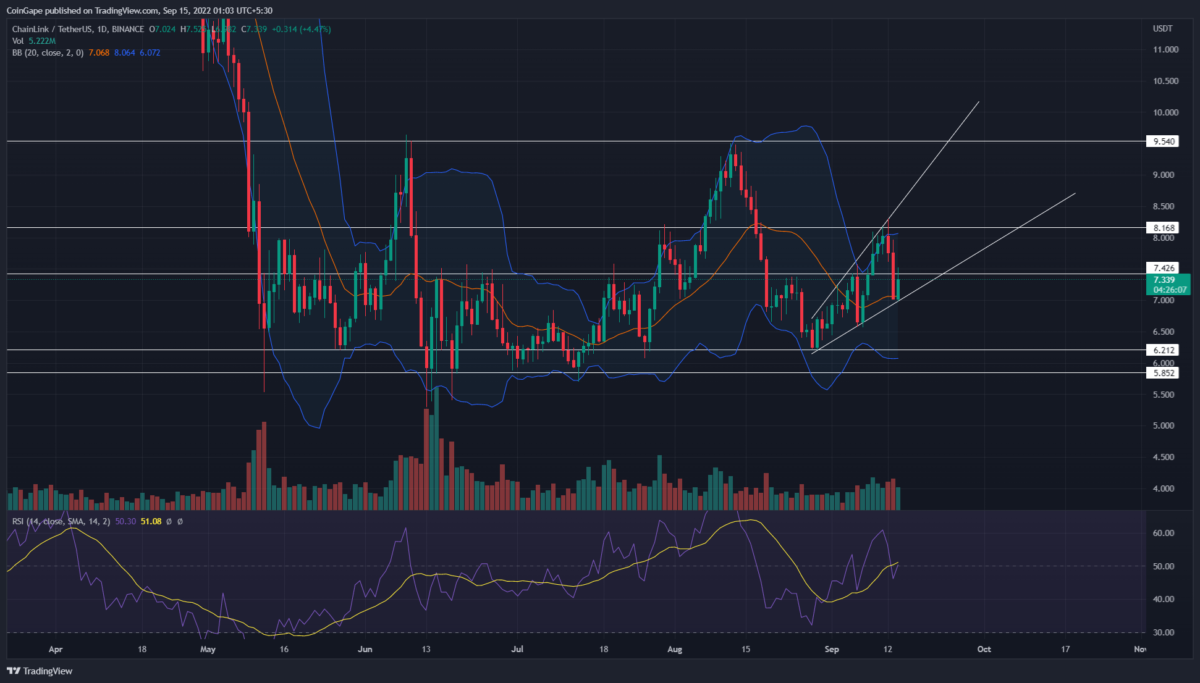
The daily technical chart shows the Chainlink price has followed a range-bound rally for the past four weeks. Several times, the coin price has retested both the upper($9.54) and lower($6.2-$5.8) barriers, validating them as areas of high interest. The ongoing recovery within the pattern aims for the upper barrier mentioned above.
Key points from Chainlink analysis
- A broadening channel pattern maintains the current recovery in chainlink price,
- The crucial EMAs(20, 50, and 100) accentuate a sideways ally
- The intraday trading volume in the LINK coin is $512.8 Billion, indicating a 7.3% loss.
A new bull cycle within this range was initiated on August 29th, when the Chainlink coin price rebounded from the $6.2 support with a bullish engulfing candle. The bull-run accounted for a 32.8% rally, which marked a high of $8.3.
However, the chainlink price shows a sharp reversal from this level as the crypto market witnessed a sudden sell-off. The downfall was caused when the recent CPI rate data pointed to 8.1% Y-o-Y inflation.
Furthermore, it seems the ongoing recovery in Chainlink coin price is responding to a broadening channel pattern. Thus, the pattern’s support trendline stalled the falling price at $7 and reverted it higher by 4.8%.
The altcoin currently trades at the $7.34 mark, and under the influence of this pattern, it could rise even to the top resistance of $9.5. However, the very nature of this pattern is bearish, and therefore, a breakdown from its support trendline will trigger a significant correction.
Thus, the trendline breakdown will accelerate the bearish momentum and plummet the prices to $6.2-$5.8 bottom support.
However, concerning the bigger picture, the chainlink coin will remain sideways until prices don’t breach the $9.5 or $5.8 barrier.
Technical Indicator
RSI indicator: the daily-RSI slope attempt to re-enter the bullish territory indicates the market participant still keeps hopes from Chainlink price
Bollinger band indicator: the coin price trading above the midline reflects the current market value is higher than the mean value from the ongoing price range.
- Resistance levels- $7.42, and $8.16
- Support levels- $6.6 and $6.2-$5.8
Recent Posts
- Price Analysis
Will Solana Price Hit $150 as Mangocueticals Partners With Cube Group on $100M SOL Treasury?
Solana price remains a focal point as it responds to both institutional alignment and shifting…
- Price Analysis
SUI Price Forecast After Bitwise Filed for SUI ETF With U.S. SEC – Is $3 Next?
SUI price remains positioned at a critical intersection of regulatory positioning and technical structure. Recent…
- Price Analysis
Bitcoin Price Alarming Pattern Points to a Dip to $80k as $2.7b Options Expires Today
Bitcoin price rebounded by 3% today, Dec. 19, reaching a high of $87,960. This rise…
- Price Analysis
Dogecoin Price Prediction Points to $0.20 Rebound as Coinbase Launches Regulated DOGE Futures
Dogecoin price has gone back to the spotlight as it responds to the growing derivatives…
- Price Analysis
Pi Coin Price Prediction as Expert Warns Bitcoin May Hit $70k After BoJ Rate Hike
Pi Coin price rose by 1.05% today, Dec. 18, mirroring the performance of Bitcoin and…
- Price Analysis
Cardano Price Outlook: Will the NIGHT Token Demand Surge Trigger a Rebound?
Cardano price has entered a decisive phase as NIGHT token liquidity rotation intersects with structural…