Bearish Pattern Threatens XRP Price For Longer Correction, But Will it?
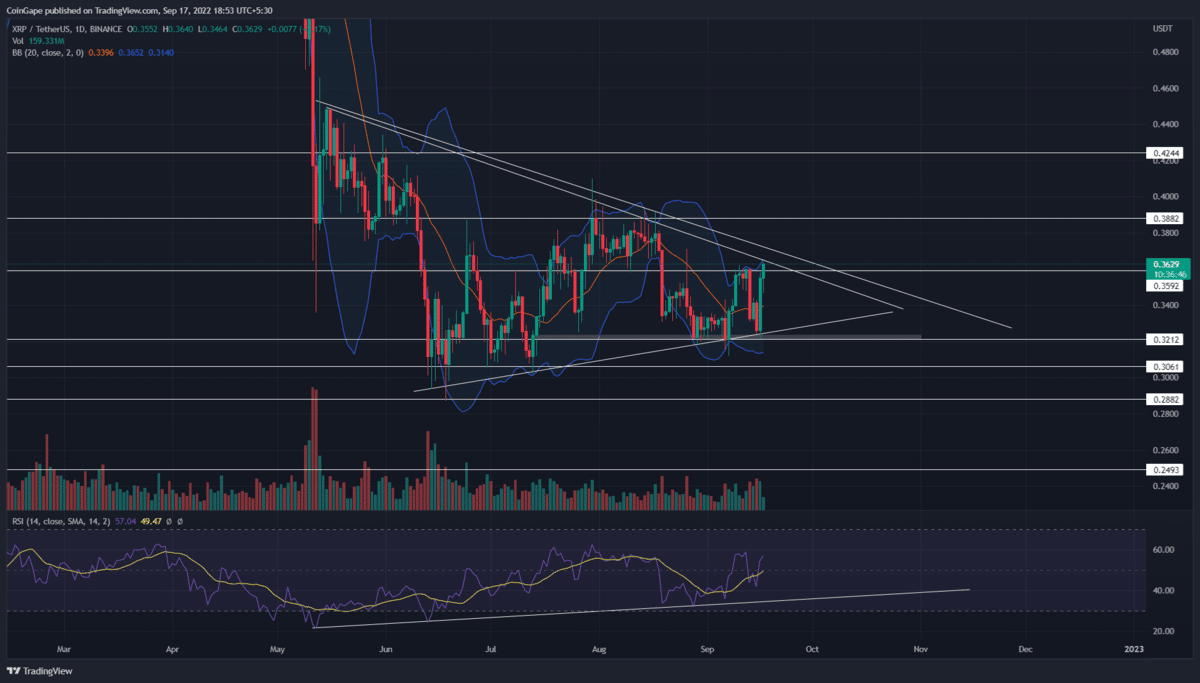
The XRP/USDT pair has been wavering in a sideways rally for the past four months. However, following the April-May bloodbath, this consolidation represents an inverted pennant pattern. As per the technical setup, this pattern offers a small break or rest period for XRP sellers before resuming the price correction.
Key points from XRP analysis:
- Under the influence of a bearish pattern, the XRP price could lose the June low support of $0.288.
- A bullish breakout from the overhead trendline will invalidate the bearish thesis
- The intraday trading volume in the XRP is $912 Million, indicating a 14% loss.
On September 16th, the XRP price rebounded from the support trendline with a massive bullish engulfing candle, registering a 9.1% gain. However, the altcoin has already hit the overhead trendline, limiting bullish growth from climbing higher.
Today, the coin price accounts for a 0.8% intraday, offering a follow-up on a bullish reversal. However, if the selling pressure persists, the XRP price witnesses a minor correction to the bottom trendline.
Also read: XRP Lawsuit: What Next After Summary Judgment Approval?
Thus, the technical chart indicates the price action has narrowed enough to be considered a no-trading zone. Therefore, until altcoin is trapped within the two converging trendlines, the sideways rally will continue for a few more sessions.
As per the theory, the coin price should breach the bottom support trendline as an indication to continue the downtrend. Completing the pattern, the XRP price would extend the correction fall to the $0.25 mark.
On a contrary note, even though the inverted flag pattern is a bearish continuation pattern, the coin price possesses a possibility of a bullish breakout from the resistance trendline. Doing so will offset the bearish pattern and may bolster a new recovery rally.
Technical Indicator
Bollinger band: the coin price retest of the indicator’s upper band suggests an upcoming bear cycle within the triangle space.
RSI: concerning the swing lows within the price pattern, the daily-RSI slope shows a significant positive divergence indicating growth in underlying bullishness. This divergence vouch for the recovery theory and suggests the price should eventually break the above trendline.
Thus, the interested traders must wait till the price doesn’t break either trendline.
- Resistance levels: $0.36 and $0.388
- Support levels: $0.32 and $0.30
Recent Posts
- Price Analysis
Pi Network Analysis: Pi Coin Price Surges on Christmas Eve, Can It Hit Year-End Highs?
Pi coin price reflect cautious positioning as market structure tightens near a key base. The…
- Price Analysis
Why Dec 26th Is A Do Or Die for Bitcoin Price Ahead Of Record Options Expiry?
As Christmas winds down, the Bitcoin price dipped 0.74% to around $86,750. Market participants…
- Price Analysis
Why Bitcoin, Ethereum And XRP Prices Are Down Today? (24 Dec)
The crypto market extended losses ahead of Christmas as Bitcoin, Ethereum, and XRP slipped further…
- Price Analysis
XRP Price Prediction: Will 4 Billion Transactions Spark Next Rally?
XRP price trades below the $2 mark after the latest correction across the broader cryptocurrency…
- Price Analysis
Solana Price Outlook: Will SOL Recover With Strong Institutional Buying?
Solana price remains steady above the $120 support after the recent crypto market pullback. The…
- Price Analysis
Ethereum Price Risks Crash to $2,500 Amid Sustained Wintermute Dumping
Ethereum price dropped below the key support at $3,000 on Tuesday, down by ~40% from…