Binance Coin (BNB) Price Eyes 10% Jump Amid Bullish Pattern Formation
The Binance coin price in four-time frame charts shows a bullish upswing under the influence of a rising channel pattern. For nearly two months, the coin price has been wobbling between the two parallel walking trendlines acting as dynamic resistance and support. The BNB price close to the bottom trendline shows a sign of a bullish reversal and potential for a sharp rally.
Also Read: BNB Price Trade Idea As Binance Bags Dubai’s Major Exchange License
Binance Price Daily Chart
- A bullish crossover between the 20 and 100 EMA should lure more buyers into the market.
- A bullish pattern sets the BNB price for a 10% upswing
- The intraday trading volume in the BNB coin is $596.5 Million, indicating a 17.5% loss
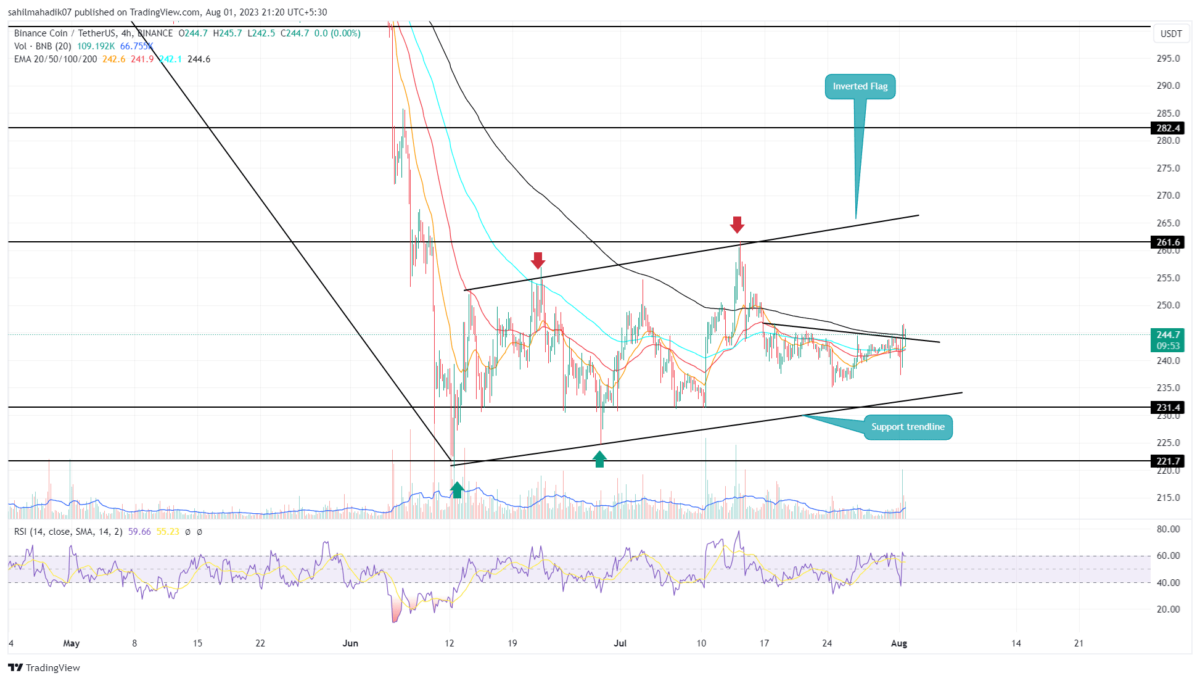
Amid the recent uncertainty in the crypto market, the BNB price showed a sideways action limited between the range of $245 to $234. This two weeks consolidation showed the formation of a bullish reversal pattern called inverted head and shoulder. With an intraday game of 1.62%, the altcoin price gave a bullish breakout from the pattern’s neckline resistance.
By the press time, the Binance coin trades at $244 and tries to sustain above the breached trendline. If the buyers manage to hold this flipped support, the altcoin could prolong the recovery by 10% and reach the overhead trendline of the channel pattern.
Until the two trendlines remain intact, the Binance coin may linger in a sideways or slightly ascending trend.
[converter id=”bnb-binance-coin” url=”https://coingape.com/price/converter/bnb-to-usd/?amount=1″]
Is BNB Price Still Under Correction Threat?
A look at the daily time frame chart shows the channel pattern is part of an inverted flag. This chart pattern is known to extend the downward trend upon the breakdown of its supported line. This crackdown will intensify the selling momentum and may plunge Binance coin to $220, followed by $200.
- Exponential Moving Average: with the recent breakout, the BNB price also reclaimed a 200-day EMA obtaining an extra boost for the long traders.
- Relatives strength index: the daily RSI slope above 60% strong bullish momentum in action
Recent Posts
- Price Analysis
Cardano Price Outlook: Will the NIGHT Token Demand Surge Trigger a Rebound?
Cardano price has entered a decisive phase as NIGHT token liquidity rotation intersects with structural…
- Price Analysis
Will Bitcoin Crash to $74K as Japan Eyes Rate Hike on December 19?
Bitcoin price continues to weaken after breaking below its recent consolidation range, now trading within…
- Price Analysis
Bitwise Predicts Solana Price Will Hit New All-Time Highs in 2026
Solana price declined by 4% over the past 24 hours, breaking below the key $130…
- Price Analysis
Bitcoin Price Outlook: Capriole Founder Warns of a Drop Below $50K by 2028
Bitcoin price narratives continue to evolve as long-term downside risks regain attention. Bitcoin price discussions…
- Price Analysis
XRP Price Rare Pattern Points to a Surge to $3 as ETFs Cross $1B Milestone
XRP price dropped by 1.2% today, Dec. 17, continuing a downward trend that started in…
- Price Analysis
DOGE Whales Add 138M Coins in 24 Hours: Will Dogecoin Price Rebound Above $0.15?
Dogecoin price traded at $0.1304 on Tuesday, up 1.39% in the last 24 hours.…