Binance Coin (BNB) Price Under FUD Pressure: Will It Retreat to $220 Support?


Amid the rising indecisiveness in the crypto market, the Binance coin price has witnessed a sideways trend for the past three weeks. This consolidation of around $240 with short-bodies and long wicks indicates no initiation from buyers or sellers. However, despite a highly volatile behavior, the coin price respects the inverted flag pattern formation, characterized by a steady downfall and an upward channel to replenish bearish momentum. Will this chart setup bring major correction in the fourth largest cryptocurrency?
Also Read: Binance Expands Support For Dogecoin, DOGE Price Rally To $0.1 Coming?
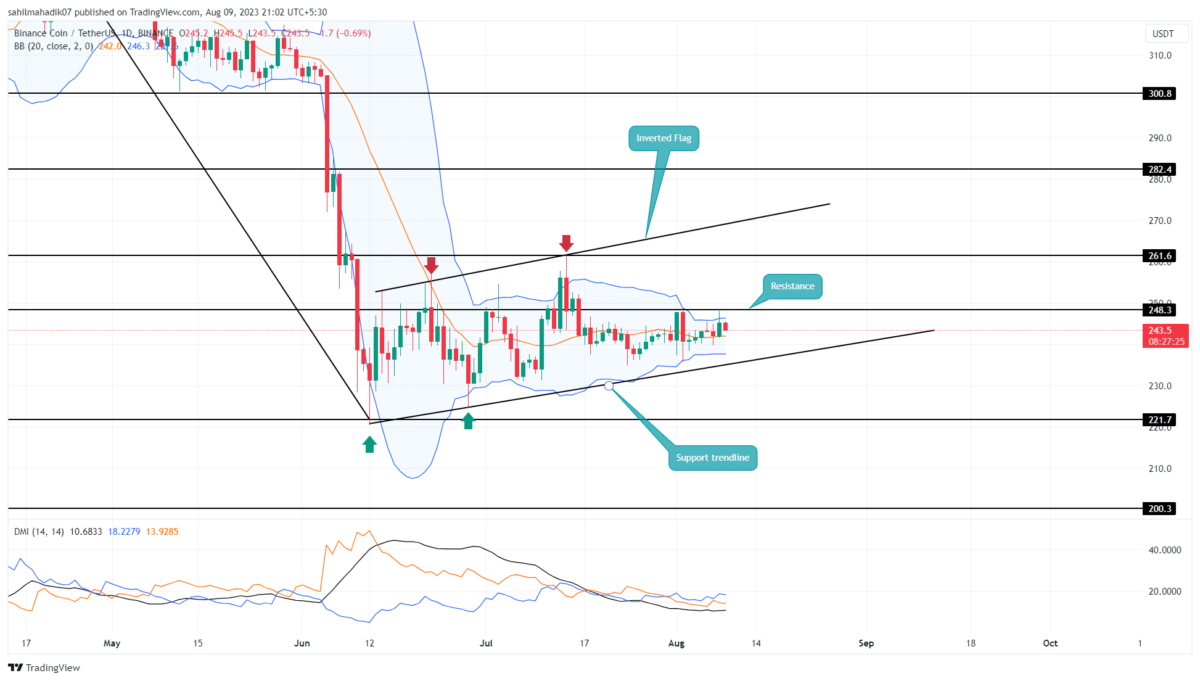
Binance Price Daily Chart
- The higher price rejection candle on August 8th indicates a high supply zone at $248.3
- A breakdown below the support trendline will trigger a major correction in BNB
- The intraday trading volume in the BNB coin is $510.2 Million, indicating a 19% gain
 Source- Tradingview
By the press time, the Binance coin price traded at $244.6 and continued with its sideways action in a narrow range. The daily chart showed multiple Doii-type candles which project uncertainty among market participants.
Currently, the coin price is resonating between the horizontal resistance of $248.3 and the rising trendline of the flag channel. Until these two levels are intact, the consolidation mode in the BNB will be extended longer.
Considering a bullish outlook, if the coin price gives an upside breakout from the $248.3 resistance, the buyers will get a strong footing to rise higher. The potential upswing could raise the altcoin 9% higher to reach $270.
[converter id=”bnb-binance-coin” url=”https://coingape.com/price/converter/bnb-to-usd/?amount=1″]
Will Rising FUD Push BNB Price Back to $200?
In theory, the inverted flag pattern is known to extend the correction trend upon the breakdown of the channel pattern. If the coin price breaks below the lower support with a daily candle, the bearish will intensify. The post-breakdown fall would tumble the prices to $220, followed by $200.
- Bollinger Band: The narrow gap of the Bollinger Band indicator reflects high volatility in the crypto market
- Directional Moving Index: A bullish crossover between the DI+(blue) and DI-(orange) slope hints at increasing buying pressure in the market.

Why Trust CoinGape
CoinGape has covered the cryptocurrency industry since 2017, aiming to provide informative insights Read more…to our readers. Our journal analysts bring years of experience in market analysis and blockchain technology to ensure factual accuracy and balanced reporting. By following our Editorial Policy, our writers verify every source, fact-check each story, rely on reputable sources, and attribute quotes and media correctly. We also follow a rigorous Review Methodology when evaluating exchanges and tools. From emerging blockchain projects and coin launches to industry events and technical developments, we cover all facets of the digital asset space with unwavering commitment to timely, relevant information.

Related Articles


- Tether and UN Join Forces for Africa’s Crypto Security as USDT Adoption Grows Across Nigeria
- Genius Act: Stablecoin Yields Face Regulatory Crackdown as Banks’ Lobby Pressures Senate
- Bitcoin Treasury Firm K Wave Media Faces Potential Nasdaq Delisting Over Falling Share Price
- CLARITY Act Update: New Advocacy Group Targets DeFi Rules Ahead of Senate Vote
- Pump.fun Announces New Upgrades to Creator Fee Model; PUMP Rises 11%
- What’s Keeping XRP Price Below $3 After a Significant Jan 2026 Rally?
- Top Crypto Analyst Predicts Cardano Price Can Hit $10: Will It?
- Ethereum Price Prediction Ahead of U.S Unemployment Data Drops Today
- Solana Price Prediction if Bitcoin Holds Above $95,000
- Dogecoin Price Eyes $0.20+ Following Massive 218M DOGE Whale Buying Spree
- How CLARITY Act Could Impact Bitcoin, Ethereum, and Dogecoin Prices?


