Binance Coin (BNB) Price Under FUD Pressure: Will It Retreat to $220 Support?
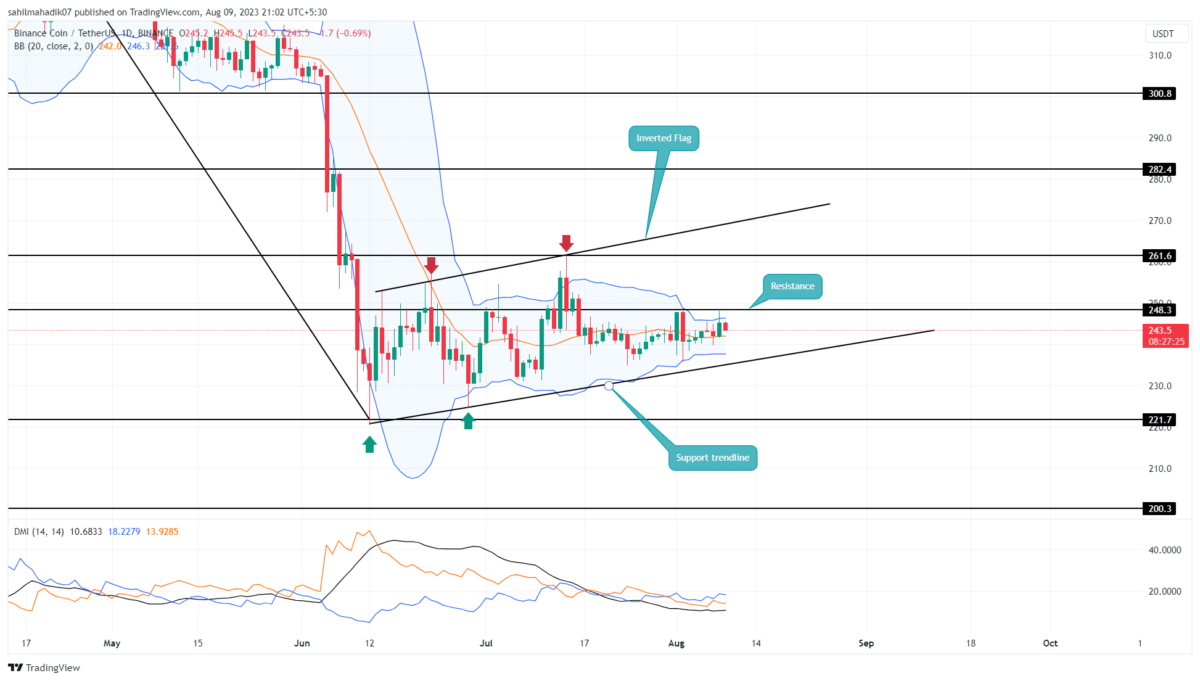
Amid the rising indecisiveness in the crypto market, the Binance coin price has witnessed a sideways trend for the past three weeks. This consolidation of around $240 with short-bodies and long wicks indicates no initiation from buyers or sellers. However, despite a highly volatile behavior, the coin price respects the inverted flag pattern formation, characterized by a steady downfall and an upward channel to replenish bearish momentum. Will this chart setup bring major correction in the fourth largest cryptocurrency?
Also Read: Binance Expands Support For Dogecoin, DOGE Price Rally To $0.1 Coming?
Binance Price Daily Chart
- The higher price rejection candle on August 8th indicates a high supply zone at $248.3
- A breakdown below the support trendline will trigger a major correction in BNB
- The intraday trading volume in the BNB coin is $510.2 Million, indicating a 19% gain
By the press time, the Binance coin price traded at $244.6 and continued with its sideways action in a narrow range. The daily chart showed multiple Doii-type candles which project uncertainty among market participants.
Currently, the coin price is resonating between the horizontal resistance of $248.3 and the rising trendline of the flag channel. Until these two levels are intact, the consolidation mode in the BNB will be extended longer.
Considering a bullish outlook, if the coin price gives an upside breakout from the $248.3 resistance, the buyers will get a strong footing to rise higher. The potential upswing could raise the altcoin 9% higher to reach $270.
[converter id=”bnb-binance-coin” url=”https://coingape.com/price/converter/bnb-to-usd/?amount=1″]
Will Rising FUD Push BNB Price Back to $200?
In theory, the inverted flag pattern is known to extend the correction trend upon the breakdown of the channel pattern. If the coin price breaks below the lower support with a daily candle, the bearish will intensify. The post-breakdown fall would tumble the prices to $220, followed by $200.
- Bollinger Band: The narrow gap of the Bollinger Band indicator reflects high volatility in the crypto market
- Directional Moving Index: A bullish crossover between the DI+(blue) and DI-(orange) slope hints at increasing buying pressure in the market.
Recent Posts
- Price Analysis
Ethereum Price Prediction 2026 As Vitalik Buterin Unveils New Scaling Roadmap
Ethereum price as the year 2026 begins has rallied past $3,100, marking a strong recovery.…
- Price Analysis
Bitcoin Price and XRP Price Prediction 2026 Ahead of US Crypto Reserve, CLARITY Act
Bitcoin price and XRP price enter 2026 trading within compression structures that reflect balance rather…
- Price Analysis
Analyst Predicts Cardano Price to Surge 103% to $0.75 as Midnight, Leios Launch Near
Cardano price started the year well, rising for the initial two days. ADA rose by…
- Price Analysis
Dogecoin Price Jumps 10% as Whales Scoop Up 220M DOGE; What’s Next?
Dogecoin price soared 10% within the last 24 hours as whale wallets accumulated more than…
- Price Analysis
Here’s Why Crypto Market Turns Bullish as 2026 Kicks Off
The crypto market began 2026 with bullish momentum after weeks of cautious trading in late…
- Price Analysis
Pepe Coin price Enters 2026 with a 25% Surge as Open Interest Jumps 82% — What’s Next?
PEPE Coin price enters the new year with visible strength after surging over 25%, as…