Binance Coin Price Analysis: Will $BNB Price Lose $250 Support Amid Recent Sell-off?


Binance Coin Price Analysis: On Monday 5th June, the BNB price witnessed a significant outflow, registering an intraday loss of 10%.This sudden downfall has more likely arisen with the lawsuit against Binance, the world’s largest cryptocurrency exchange, and its CEO, Changpeng “CZ” Zhao. By the press, the daily chart shows no buying pressure from the bottom indicating the Binance coin is poised for further downfall.
Also Read: Binance Officially Responds To SEC Lawsuit, Claims To “Vigourously” Defend Allegations
Binance Price Daily Chart
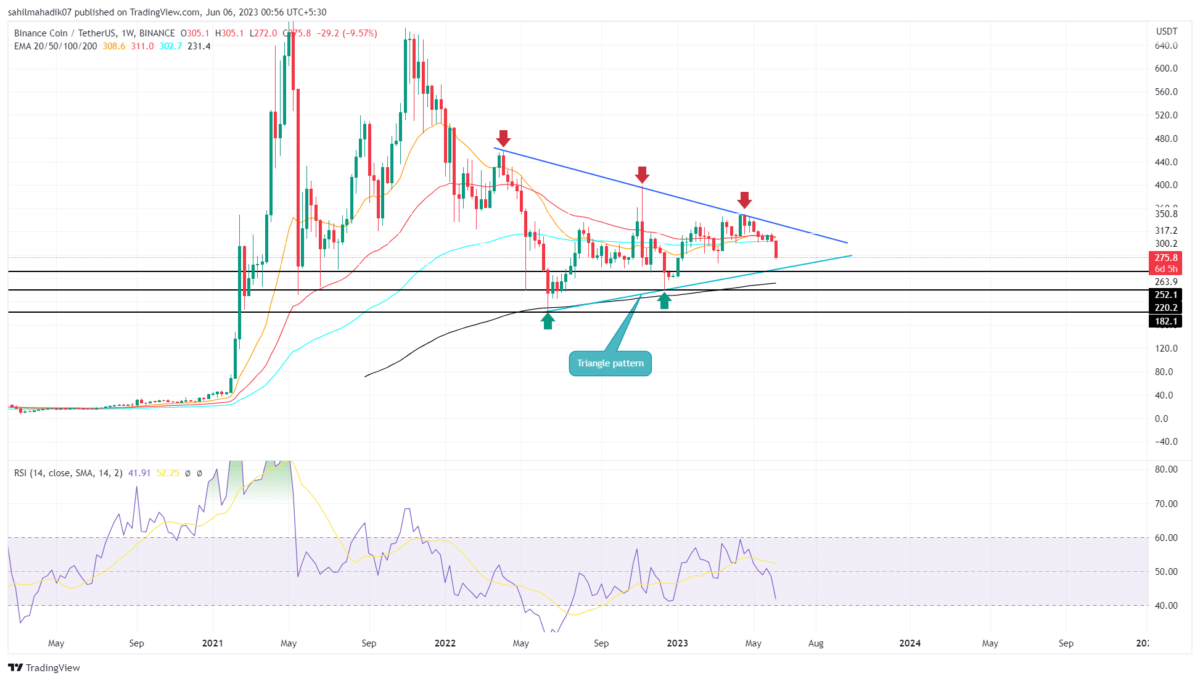
- A symmetrical triangle pattern has been caring the ongoing sideways trend in the BNB price
- A breakdown below the pattern’s support trendline will trigger a massive correction
- The intraday trading volume in the BNB coin is $389.5 Million, indicating an 11.2% loss
 Source- Tradingview
Amid the recent downfall, the BNB price plunged to the $276.6 mark, accounting for 21% in the last two months. However, taking a look at a longer time frame chart, the coin price showed the formation of a symmetrical triangle pattern.
This pattern in the weekly chart indicates the ongoing correction still lies under its premise and the overall sideways trend is not hampered. Under the influence of this pattern and the current negative sentiment, the Binance coin price may tumble 8% and hit the $252-$250 support.
Moreover, the aforementioned support aligned with the lower trendline of the triangle pattern which prevented the BNB price from an excess downtrend. Until this pattern is intact, the coin holders can maintain a bullish sentiment and expect a recovery soon.
Will Binance Coin Price Reach $250 Support?
Under the development of a symmetrical triangle pattern, the BNB price walked a sideways trend for over a year. Amid the current correction, the coin price will likely retest the lower support trendline of the pattern which previously triggered a massive recovery cycle. Therefore, the Binance coin price is more likely to rebound from the $250 support useless we have some more negative views on this crypto exchange.
- Relative Strength Index: The weekly RSI slope dives deeper into the bearish territory indicating the supply pressure is strong, and therefore, the sellers could accelerate a downfall to $250.
- Exponential Moving Average: The coin price is still above the 200-weekly EMA project and the overall trend is bullish.

Why Trust CoinGape
CoinGape has covered the cryptocurrency industry since 2017, aiming to provide informative insights Read more…to our readers. Our journal analysts bring years of experience in market analysis and blockchain technology to ensure factual accuracy and balanced reporting. By following our Editorial Policy, our writers verify every source, fact-check each story, rely on reputable sources, and attribute quotes and media correctly. We also follow a rigorous Review Methodology when evaluating exchanges and tools. From emerging blockchain projects and coin launches to industry events and technical developments, we cover all facets of the digital asset space with unwavering commitment to timely, relevant information.
Related Articles


- BGB Sees Adoption Boost as Kraken Lists Token
- Breaking: U.S. PPI Inflation Comes In Hot At 3%, Bitcoin Falls
- Best Crypto Payment Plugins for WooCommerce [2026 Guide]
- Breaking: Trump Nominates Pro-Bitcoin Kevin Warsh As Next Fed Chair
- Crypto ETF News: Bitcoin, Ethereum Funds See $1B in Outflows as Bullish Sentiment Fades
- Ethereum Price Prediction As Vitalik Withdraws ETH Worth $44M- Is a Crash to $2k ahead?
- Bitcoin Price Prediction as Trump Names Kevin Warsh as new Fed Reserve Chair
- XRP Price Outlook Ahead of Possible Government Shutdown
- Ethereum and XRP Price Prediction as Odds of Trump Attack on Iran Rise
- Gold and S&P 500 Price Prediction as BTC $88K Sparks Global Risk-On Rally
- How High Can Hyperliquid Price Go in Feb 2026?


