

Bitcoin (BTC) Price Holds Key Level Near $20,200; Time To Exit?


Bitcoin’s (BTC) price analysis indicates a sideways movement with a negative bias. BTC is hovering near $20,000 on the weekend. The market remained cautious following U.S. Fed Chair Jerome Powell’s comments on Friday during Jackson Hole Summit.
- Bitcoin price trades cautiously following the consolidation.
- The price dropped below $21,000 amid a cautious market mood.
- The momentum oscillator turns neutral to bearish.
Bitcoin price trades cautiously before the next big move
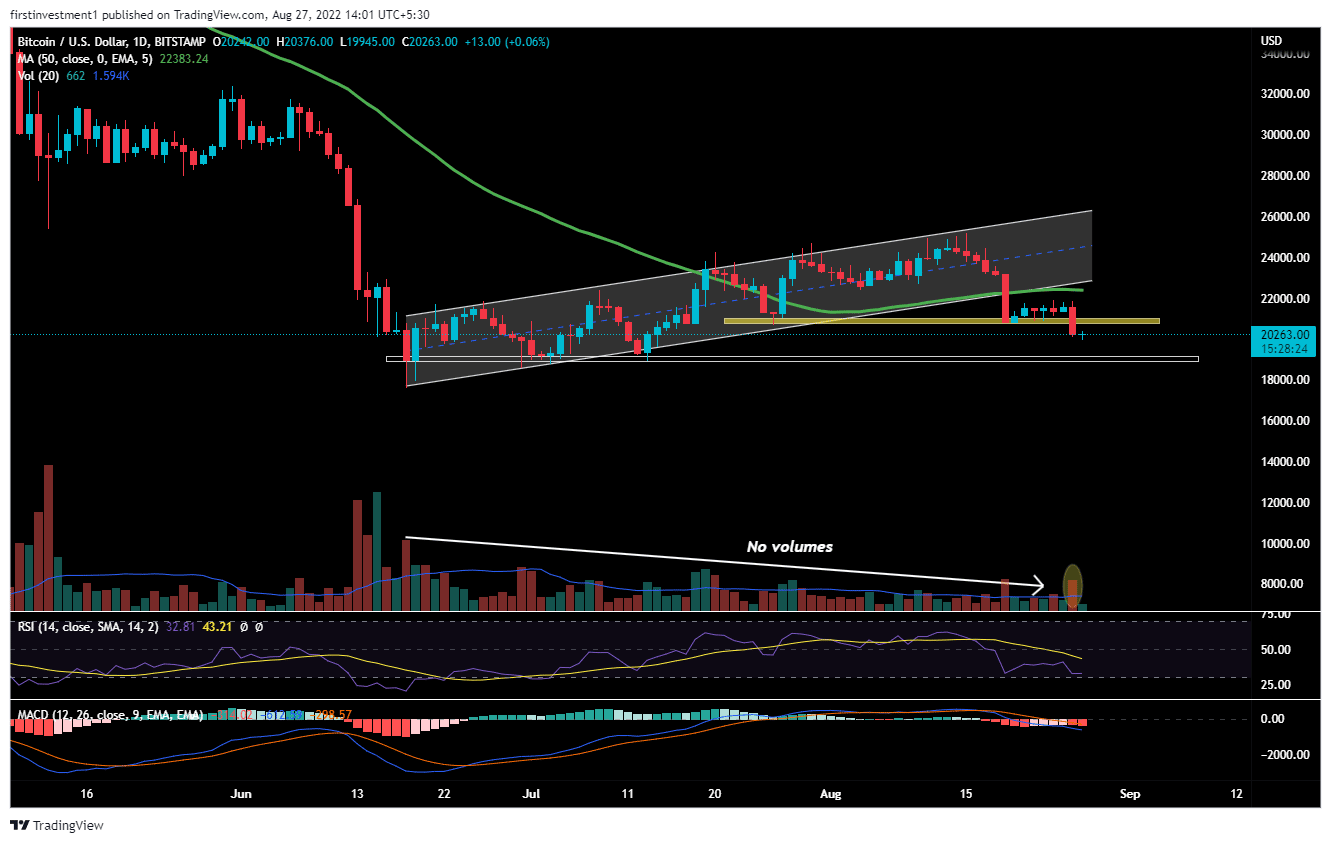
On the daily chart, BTC gave a breakdown of the bearish “Flag & Pole” Pattern on August. 19. The price goes into isolation for a week, with no movement whatsoever.
Further, the price finally breaks the low of the pattern’s breakdown candle and closes below it in August. 26. Along with an above-the-average volume, as shown in the chart. This combination of price and volume prints a bearish outlook for the largest coin in the short term.
In addition, more bearishness added to the price as it slipped below the 50-day exponential moving average & is sustaining below that level.
The Bitcoin price is in a Distribution phase between August 20 to August 25. Distribution means big players are selling the asset after an impulse move without moving the prices too much. It’s a sideways/range-bound market activity that happens after an extended move.
According to this pattern, The expected fall in BTC price could be calculated toward $19,300, if the price closes below ($20,000). To find targets for Flag Pattern, the Fibonacci extension indicator is used, which gives us more than 75% accurate targets.
The nearest support is $19,900, whereas the nearest resistance is at around $21,000. There is a higher probability of the price breaking its support. But, if any chance price tends to come close to its resistance, and we’ve seen any rejection there, then we can sell there as well “Sell on rising” Opportunity.
Also read: https://coingape.com/can-bitcoin-rebound-after-powells-doom-and-gloom-speech/
The RSI is trading below 50. When the relative strength index is below 50, it generally means that the losses are greater than the gains. Whereas, the MACD line crosses below the signal line below zero, indicating a bearish trend.
On the other hand, a renewed buying pressure could push the price above the $21,000 level. This would alter could the bearish outlook. And the price can move above $22,500.
BTC is bearish on all time frames. Below $19,900 closing on the hourly time frame, we can put a trade on the sell side.
As of press time, BTC/USD is trading at $20,230, down 0.55% for the day. The 24-hour trading volume held near $42.96 billion up 42% according to CoinMarketCap data.

Why Trust CoinGape
CoinGape has covered the cryptocurrency industry since 2017, aiming to provide informative insights Read more…to our readers. Our journal analysts bring years of experience in market analysis and blockchain technology to ensure factual accuracy and balanced reporting. By following our Editorial Policy, our writers verify every source, fact-check each story, rely on reputable sources, and attribute quotes and media correctly. We also follow a rigorous Review Methodology when evaluating exchanges and tools. From emerging blockchain projects and coin launches to industry events and technical developments, we cover all facets of the digital asset space with unwavering commitment to timely, relevant information.
Premium Partners


Related Articles


- Dormant Bitcoin Whale Awakens with $30M Profit
- Bitcoin, AI Coins Bounce as Nvidia Signs $20B AI Inference Deal with Groq
- PENGU Rises Despite Crypto Market Downtrend as Pudgy Penguins Appear on Las Vegas Sphere
- Binance Lists First Nation–Backed Stablecoin; CZ Reacts
- U.S. Initial Jobless Claims Fall To 214,000; BTC Price Drops
- XRP, Bitcoin, Ethereum Price Predictions Ahead of Jan 2026 CLARITY Act and US Crypto Reserve Plans
- Pi Network Analysis: Pi Coin Price Surges on Christmas Eve, Can It Hit Year-End Highs?
- Why Dec 26th Is A Do Or Die for Bitcoin Price Ahead Of Record Options Expiry?
- Why Bitcoin, Ethereum And XRP Prices Are Down Today? (24 Dec)
- XRP Price Prediction: Will 4 Billion Transactions Spark Next Rally?
- Solana Price Outlook: Will SOL Recover With Strong Institutional Buying?


