
Highlights
Bitcoin (BTC) price today trades at $66,256.0 as of 11 PM. BTC price hit a daily high of $68,655.0 today after sliding -2.69% on February 18.
Although Bitcoin price saw a good run up on the weekend, the selling pressure throughout the week caused BTC to slide lower. This has been the main reason for Bitcoin crashing today. With the price of BTC down 1.20% and trading at $67,430, investors can expect New York open to restart the selloff.

*bitcoin price updated as of 11 PM.
Price of BTC exchanges hands at $67,430, which is far lower than $69,000, a level seen at the start of the week. This short-term bearish outlook in Bitcoin price has brought the year-to-date gain down from 56% on October 20 to 52% as of October 25.
Still, Bitcoin remains one of the largest cryptocurrency by market capitalization and its popularity can be attributed to the first-mover advantage. Furthermore, the BTC blockchain remaining a secure, decentralized and relatively scalable network has kept it at the forefront as the king of cryptocurrencies.
Other narratives like digital gold, inflation hedge, uncorrelated asset, have also helped gain widespread adoption for BTC.
Last week, it seemed as though Bitcoin price was ready to end its seven-month consolidation. But massive selling pressure above $69,000 led to a reversal. Since then, BTC has dropped roughly $2,000 of its value and currently trades at $67,430.
Its YTD returns are diminishing but the fourth quarter outlook remains bullish. Historical data hints that Bitcoin price has rallied an average of 82% in the fourth quarter. So far, BTC has only shot up 11% in the first month of Q4, which promises that the outlook remains bullish in the long-term for BTC.
With the US presidential elections coming to a conclusion in the first week of November, investors can expect a massive spike in volatility that leads to the start of a bull run. Regardless of who wins, markets have responded on a bullish notep.

With that said, if Bitcoin price hits a new ATH in December, Bitcoin’s market capitalization, which stands at $1,309.5 billion could push toward the $2 trillion mark.
While Bitcoin’s market cap hovers around $1,309.5 billion, with Ethereum, the duo controls nearly 65% of the total cryptocurrency market capitalization which stands at $2.40 trillion. Despite the seven-month consolidation, Bitcoin’s $1.3 trillion market cap remains strong with anticipation of it reaching $2 trillion in 2025.
Being the top crypto has its benefits; more people tend to flock toward the asset. Likewise, BTC’s 24-hour trading volume stands at $36.3 billion. With a major portion of this volume being contributed by Binance, one of the largest cryptocurrency exchanges. Binance’s share of BTC’s 24-hour trading volume is made up of spot and perpetuals trading. While spot volume hovers around 11%, perpetual volume stands at 41%. Exchanges like OKX, Bitget, etc, follow Binance.
With a market cap of $1.3 trillion, it is necessary for the network to remain secure, decentralized and scalable. This is possible by upgrading the Bitcoin network on a regular basis.
Here are some notable upgrades the Bitcoin network has received or planned to receive since its inception in 2009.
Here are some key milestone upgrades to the Bitcoin network over the past decade.
2020-2024
Bitcoin Core 0.3.0 Upgrade (October 2009)
The seve-month consolidation could come to an end soon. The end of US presidential elections could kickstart the BTC bull rally by November second week. Investors expect the uptrend to be extremely bullish if Donald Trump wins.
However, data shows, regardless of who wins, conclusion of the US elections are bullish for markets, be it crypto or stocks. So, Bitcoin price hitting a new ATH before 2024 is not unlikely. As a result, the next few weeks are critical in setting the tone for Bitcoin and the rest of the crypto markets.
| Date | Price | Change |
|---|---|---|
| February 17, 2026 | 69062.14 | -0.86% |
| February 18, 2026 | 70040.80 | 0.54% |
| February 19, 2026 | 71019.46 | 1.95% |
| February 20, 2026 | 71998.12 | 3.35% |
| February 21, 2026 | 73318.15 | 5.25% |
| February 22, 2026 | 74684.73 | 7.21% |
| February 23, 2026 | 76051.30 | 9.17% |
| February 24, 2026 | 77144.63 | 10.74% |
| February 25, 2026 | 78151.68 | 12.19% |
| February 26, 2026 | 79158.72 | 13.63% |
| February 27, 2026 | 79280.93 | 13.81% |
| February 28, 2026 | 78905.42 | 13.27% |
| March 01, 2026 | 78529.91 | 12.73% |
| March 02, 2026 | 78007.46 | 11.98% |
| March 03, 2026 | 77349.37 | 11.04% |
| March 04, 2026 | 76691.29 | 10.09% |
| March 05, 2026 | 76372.47 | 9.63% |
| March 06, 2026 | 76562.58 | 9.91% |
| March 07, 2026 | 76752.68 | 10.18% |
| March 08, 2026 | 76987.19 | 10.52% |
| March 09, 2026 | 77335.87 | 11.02% |
| March 10, 2026 | 77684.55 | 11.52% |
| March 11, 2026 | 77969.71 | 11.93% |
| March 12, 2026 | 77921.43 | 11.86% |
| March 13, 2026 | 77873.14 | 11.79% |
| March 14, 2026 | 77819.13 | 11.71% |
| March 15, 2026 | 77627.71 | 11.43% |
| March 16, 2026 | 77436.29 | 11.16% |
| March 17, 2026 | 77244.87 | 10.89% |
| March 18, 2026 | 77080.95 | 10.65% |
While BTC’s short-term outlook is uncertain investors can anticipate BTC to rally 38% on November 14 and hit $92,226.
| Month | Minimum Price | Average Price | Maximum Price | Potential ROI |
|---|---|---|---|---|
| January | $102,671.88 | $83,855.35 | $94,997.12 | 10% |
| February | $105,203.17 | $88,429.78 | $100,283.48 | 16.2% |
| March | $107,734.45 | $93,004.20 | $105,569.83 | 22.3% |
| April | $110,265.73 | $97,578.62 | $110,856.18 | 28.4% |
| May | $112,797.02 | $102,153.04 | $116,142.53 | 34.5% |
| June | $115,328.30 | $106,727.47 | $121,428.89 | 40.7% |
| July | $117,859.58 | $111,301.89 | $126,715.24 | 46.8% |
| August | $120,390.87 | $115,876.31 | $132,001.59 | 52.9% |
| September | $122,922.15 | $120,450.73 | $137,287.94 | 59% |
| October | $125,453.43 | $125,025.16 | $142,574.30 | 65.1% |
| November | $127,984.72 | $129,599.58 | $147,860.65 | 71.3% |
| December | $130,516 | $134,174 | $153,147 | 77.4% |
| All Time | $116,593.94 | $109,014.68 | $124,072.06 | 43.7% |
| Month | Minimum Price | Average Price | Maximum Price | Potential ROI |
|---|---|---|---|---|
| January | $135,324.25 | $139,236.42 | $158,676.92 | 83.8% |
| February | $140,132.50 | $144,298.83 | $164,206.83 | 90.2% |
| March | $144,940.75 | $149,361.25 | $169,736.75 | 96.6% |
| April | $149,749 | $154,423.67 | $175,266.67 | 103% |
| May | $154,557.25 | $159,486.08 | $180,796.58 | 109.4% |
| June | $159,365.50 | $164,548.50 | $186,326.50 | 115.8% |
| July | $164,173.75 | $169,610.92 | $191,856.42 | 122.2% |
| August | $168,982 | $174,673.33 | $197,386.33 | 128.6% |
| September | $173,790.25 | $179,735.75 | $202,916.25 | 135% |
| October | $178,598.50 | $184,798.17 | $208,446.17 | 141.4% |
| November | $183,406.75 | $189,860.58 | $213,976.08 | 147.8% |
| December | $188,215 | $194,923 | $219,506 | 154.3% |
| All Time | $161,769.63 | $167,079.71 | $189,091.46 | 119% |
| Month | Minimum Price | Average Price | Maximum Price | Potential ROI |
|---|---|---|---|---|
| January | $195,481 | $202,279.75 | $228,347.58 | 164.5% |
| February | $202,747 | $209,636.50 | $237,189.17 | 174.7% |
| March | $210,013 | $216,993.25 | $246,030.75 | 185% |
| April | $217,279 | $224,350 | $254,872.33 | 195.2% |
| May | $224,545 | $231,706.75 | $263,713.92 | 205.5% |
| June | $231,811 | $239,063.50 | $272,555.50 | 215.7% |
| July | $239,077 | $246,420.25 | $281,397.08 | 225.9% |
| August | $246,343 | $253,777 | $290,238.67 | 236.2% |
| September | $253,609 | $261,133.75 | $299,080.25 | 246.4% |
| October | $260,875 | $268,490.50 | $307,921.83 | 256.7% |
| November | $268,141 | $275,847.25 | $316,763.42 | 266.9% |
| December | $275,407 | $283,204 | $325,605 | 277.2% |
| All Time | $235,444 | $242,741.88 | $276,976.29 | 220.8% |
| Month | Minimum Price | Average Price | Maximum Price | Potential ROI |
|---|---|---|---|---|
| January | $285,565.25 | $293,892.50 | $338,177.42 | 291.7% |
| February | $295,723.50 | $304,581 | $350,749.83 | 306.3% |
| March | $305,881.75 | $315,269.50 | $363,322.25 | 320.8% |
| April | $316,040 | $325,958 | $375,894.67 | 335.4% |
| May | $326,198.25 | $336,646.50 | $388,467.08 | 350% |
| June | $336,356.50 | $347,335 | $401,039.50 | 364.5% |
| July | $346,514.75 | $358,023.50 | $413,611.92 | 379.1% |
| August | $356,673 | $368,712 | $426,184.33 | 393.7% |
| September | $366,831.25 | $379,400.50 | $438,756.75 | 408.2% |
| October | $376,989.50 | $390,089 | $451,329.17 | 422.8% |
| November | $387,147.75 | $400,777.50 | $463,901.58 | 437.3% |
| December | $397,306 | $411,466 | $476,474 | 451.9% |
| All Time | $341,435.63 | $352,679.25 | $407,325.71 | 371.8% |
| Month | Minimum Price | Average Price | Maximum Price | Potential ROI |
|---|---|---|---|---|
| January | $413,770.83 | $428,465.33 | $493,358.42 | 471.5% |
| February | $430,235.67 | $445,464.67 | $510,242.83 | 491% |
| March | $446,700.50 | $462,464 | $527,127.25 | 510.6% |
| April | $463,165.33 | $479,463.33 | $544,011.67 | 530.1% |
| May | $479,630.17 | $496,462.67 | $560,896.08 | 549.7% |
| June | $496,095 | $513,462 | $577,780.50 | 569.2% |
| July | $512,559.83 | $530,461.33 | $594,664.92 | 588.8% |
| August | $529,024.67 | $547,460.67 | $611,549.33 | 608.4% |
| September | $545,489.50 | $564,460 | $628,433.75 | 627.9% |
| October | $561,954.33 | $581,459.33 | $645,318.17 | 647.5% |
| November | $578,419.17 | $598,458.67 | $662,202.58 | 667% |
| December | $594,884 | $615,458 | $679,087 | 686.6% |
| All Time | $504,327.42 | $521,961.67 | $586,222.71 | 579% |
While 2023 and 2024 have been good years for crypto investors, the next five years are going to be even better based on Coingape’s Bitcoin price prediction. Between 2025 and 2029, BTC will restart the bull run and touch the six-digit territory. To be precise, BTC could valued between $82,213.41 in 2025 and $660,471.83 by 2029.
| Month | Minimum Price | Average Price | Maximum Price | Potential ROI |
|---|---|---|---|---|
| January | $617,065.67 | $637,976.67 | $709,750.17 | 722.1% |
| February | $639,247.33 | $660,495.33 | $740,413.33 | 757.6% |
| March | $661,429 | $683,014 | $771,076.50 | 793.1% |
| April | $683,610.67 | $705,532.67 | $801,739.67 | 828.7% |
| May | $705,792.33 | $728,051.33 | $832,402.83 | 864.2% |
| June | $727,974 | $750,570 | $863,066 | 899.7% |
| July | $750,155.67 | $773,088.67 | $893,729.17 | 935.2% |
| August | $772,337.33 | $795,607.33 | $924,392.33 | 970.7% |
| September | $794,519 | $818,126 | $955,055.50 | 1006.2% |
| October | $816,700.67 | $840,644.67 | $985,718.67 | 1041.8% |
| November | $838,882.33 | $863,163.33 | $1,016,381.83 | 1077.3% |
| December | $861,064 | $885,682 | $1,047,045 | 1112.8% |
| All Time | $739,064.83 | $761,829.33 | $878,397.58 | 917.5% |
| Month | Minimum Price | Average Price | Maximum Price | Potential ROI |
|---|---|---|---|---|
| January | $893,600.33 | $919,119.08 | $1,083,647 | 1155.2% |
| February | $926,136.67 | $952,556.17 | $1,120,249 | 1197.6% |
| March | $958,673 | $985,993.25 | $1,156,851 | 1240% |
| April | $991,209.33 | $1,019,430.33 | $1,193,453 | 1282.4% |
| May | $1,023,745.67 | $1,052,867.42 | $1,230,055 | 1324.8% |
| June | $1,056,282 | $1,086,304.50 | $1,266,657 | 1367.2% |
| July | $1,088,818.33 | $1,119,741.58 | $1,303,259 | 1409.6% |
| August | $1,121,354.67 | $1,153,178.67 | $1,339,861 | 1452% |
| September | $1,153,891 | $1,186,615.75 | $1,376,463 | 1494.4% |
| October | $1,186,427.33 | $1,220,052.83 | $1,413,065 | 1536.8% |
| November | $1,218,963.67 | $1,253,489.92 | $1,449,667 | 1579.2% |
| December | $1,251,500 | $1,286,927 | $1,486,269 | 1621.6% |
| All Time | $1,072,550.17 | $1,103,023.04 | $1,284,958 | 1388.4% |
| Month | Minimum Price | Average Price | Maximum Price | Potential ROI |
|---|---|---|---|---|
| January | $1,300,715.75 | $1,338,552.75 | $1,545,122.92 | 1689.7% |
| February | $1,349,931.50 | $1,390,178.50 | $1,603,976.83 | 1757.9% |
| March | $1,399,147.25 | $1,441,804.25 | $1,662,830.75 | 1826.1% |
| April | $1,448,363 | $1,493,430 | $1,721,684.67 | 1894.2% |
| May | $1,497,578.75 | $1,545,055.75 | $1,780,538.58 | 1962.4% |
| June | $1,546,794.50 | $1,596,681.50 | $1,839,392.50 | 2030.6% |
| July | $1,596,010.25 | $1,648,307.25 | $1,898,246.42 | 2098.7% |
| August | $1,645,226 | $1,699,933 | $1,957,100.33 | 2166.9% |
| September | $1,694,441.75 | $1,751,558.75 | $2,015,954.25 | 2235.1% |
| October | $1,743,657.50 | $1,803,184.50 | $2,074,808.17 | 2303.3% |
| November | $1,792,873.25 | $1,854,810.25 | $2,133,662.08 | 2371.4% |
| December | $1,842,089 | $1,906,436 | $2,192,516 | 2439.6% |
| All Time | $1,571,402.38 | $1,622,494.38 | $1,868,819.46 | 2064.7% |
| Month | Minimum Price | Average Price | Maximum Price | Potential ROI |
|---|---|---|---|---|
| January | $1,908,609.25 | $1,973,948.75 | $2,276,708.17 | 2537.1% |
| February | $1,975,129.50 | $2,041,461.50 | $2,360,900.33 | 2634.6% |
| March | $2,041,649.75 | $2,108,974.25 | $2,445,092.50 | 2732.2% |
| April | $2,108,170 | $2,176,487 | $2,529,284.67 | 2829.7% |
| May | $2,174,690.25 | $2,243,999.75 | $2,613,476.83 | 2927.2% |
| June | $2,241,210.50 | $2,311,512.50 | $2,697,669 | 3024.7% |
| July | $2,307,730.75 | $2,379,025.25 | $2,781,861.17 | 3122.2% |
| August | $2,374,251 | $2,446,538 | $2,866,053.33 | 3219.8% |
| September | $2,440,771.25 | $2,514,050.75 | $2,950,245.50 | 3317.3% |
| October | $2,507,291.50 | $2,581,563.50 | $3,034,437.67 | 3414.8% |
| November | $2,573,811.75 | $2,649,076.25 | $3,118,629.83 | 3512.3% |
| December | $2,640,332 | $2,716,589 | $3,202,822 | 3609.8% |
| All Time | $2,274,470.63 | $2,345,268.88 | $2,739,765.08 | 3073.5% |
| Month | Minimum Price | Average Price | Maximum Price | Potential ROI |
|---|---|---|---|---|
| January | $2,728,184.50 | $2,811,669.67 | $3,268,702.33 | 3686.2% |
| February | $2,816,037 | $2,906,750.33 | $3,334,582.67 | 3762.5% |
| March | $2,903,889.50 | $3,001,831 | $3,400,463 | 3838.8% |
| April | $2,991,742 | $3,096,911.67 | $3,466,343.33 | 3915.1% |
| May | $3,079,594.50 | $3,191,992.33 | $3,532,223.67 | 3991.4% |
| June | $3,167,447 | $3,287,073 | $3,598,104 | 4067.7% |
| July | $3,255,299.50 | $3,382,153.67 | $3,663,984.33 | 4144% |
| August | $3,343,152 | $3,477,234.33 | $3,729,864.67 | 4220.3% |
| September | $3,431,004.50 | $3,572,315 | $3,795,745 | 4296.6% |
| October | $3,518,857 | $3,667,395.67 | $3,861,625.33 | 4372.9% |
| November | $3,606,709.50 | $3,762,476.33 | $3,927,505.67 | 4449.3% |
| December | $3,694,562 | $3,857,557 | $3,993,386 | 4525.6% |
| All Time | $3,211,373.25 | $3,334,613.33 | $3,631,044.17 | 4105.9% |
| Month | Minimum Price | Average Price | Maximum Price | Potential ROI |
|---|---|---|---|---|
| January | $3,794,170.25 | $3,957,165.25 | $4,111,104.92 | 4661.9% |
| February | $3,893,778.50 | $4,056,773.50 | $4,228,823.83 | 4798.3% |
| March | $3,993,386.75 | $4,156,381.75 | $4,346,542.75 | 4934.6% |
| April | $4,092,995 | $4,255,990 | $4,464,261.67 | 5071% |
| May | $4,192,603.25 | $4,355,598.25 | $4,581,980.58 | 5207.3% |
| June | $4,292,211.50 | $4,455,206.50 | $4,699,699.50 | 5343.7% |
| July | $4,391,819.75 | $4,554,814.75 | $4,817,418.42 | 5480% |
| August | $4,491,428 | $4,654,423 | $4,935,137.33 | 5616.4% |
| September | $4,591,036.25 | $4,754,031.25 | $5,052,856.25 | 5752.8% |
| October | $4,690,644.50 | $4,853,639.50 | $5,170,575.17 | 5889.1% |
| November | $4,790,252.75 | $4,953,247.75 | $5,288,294.08 | 6025.5% |
| December | $4,889,861 | $5,052,856 | $5,406,013 | 6161.8% |
| All Time | $4,342,015.63 | $4,505,010.63 | $4,758,558.96 | 5411.9% |
The forecasts hint at a common bullish trend for Bitcoin in the long term, similar to what was obsered betwene 2025 and 2029. Between the next two decades, BTC will note a bullish explosive trend that pushes it up to have an average price between $2.9 million and $3.3 million per coin.
Disclaimer:
Investors should take these long-term predictions with a grain of salt and consider that these forecasts are bound to change depending on the macroeconomic and geopolitical landscape at the time.
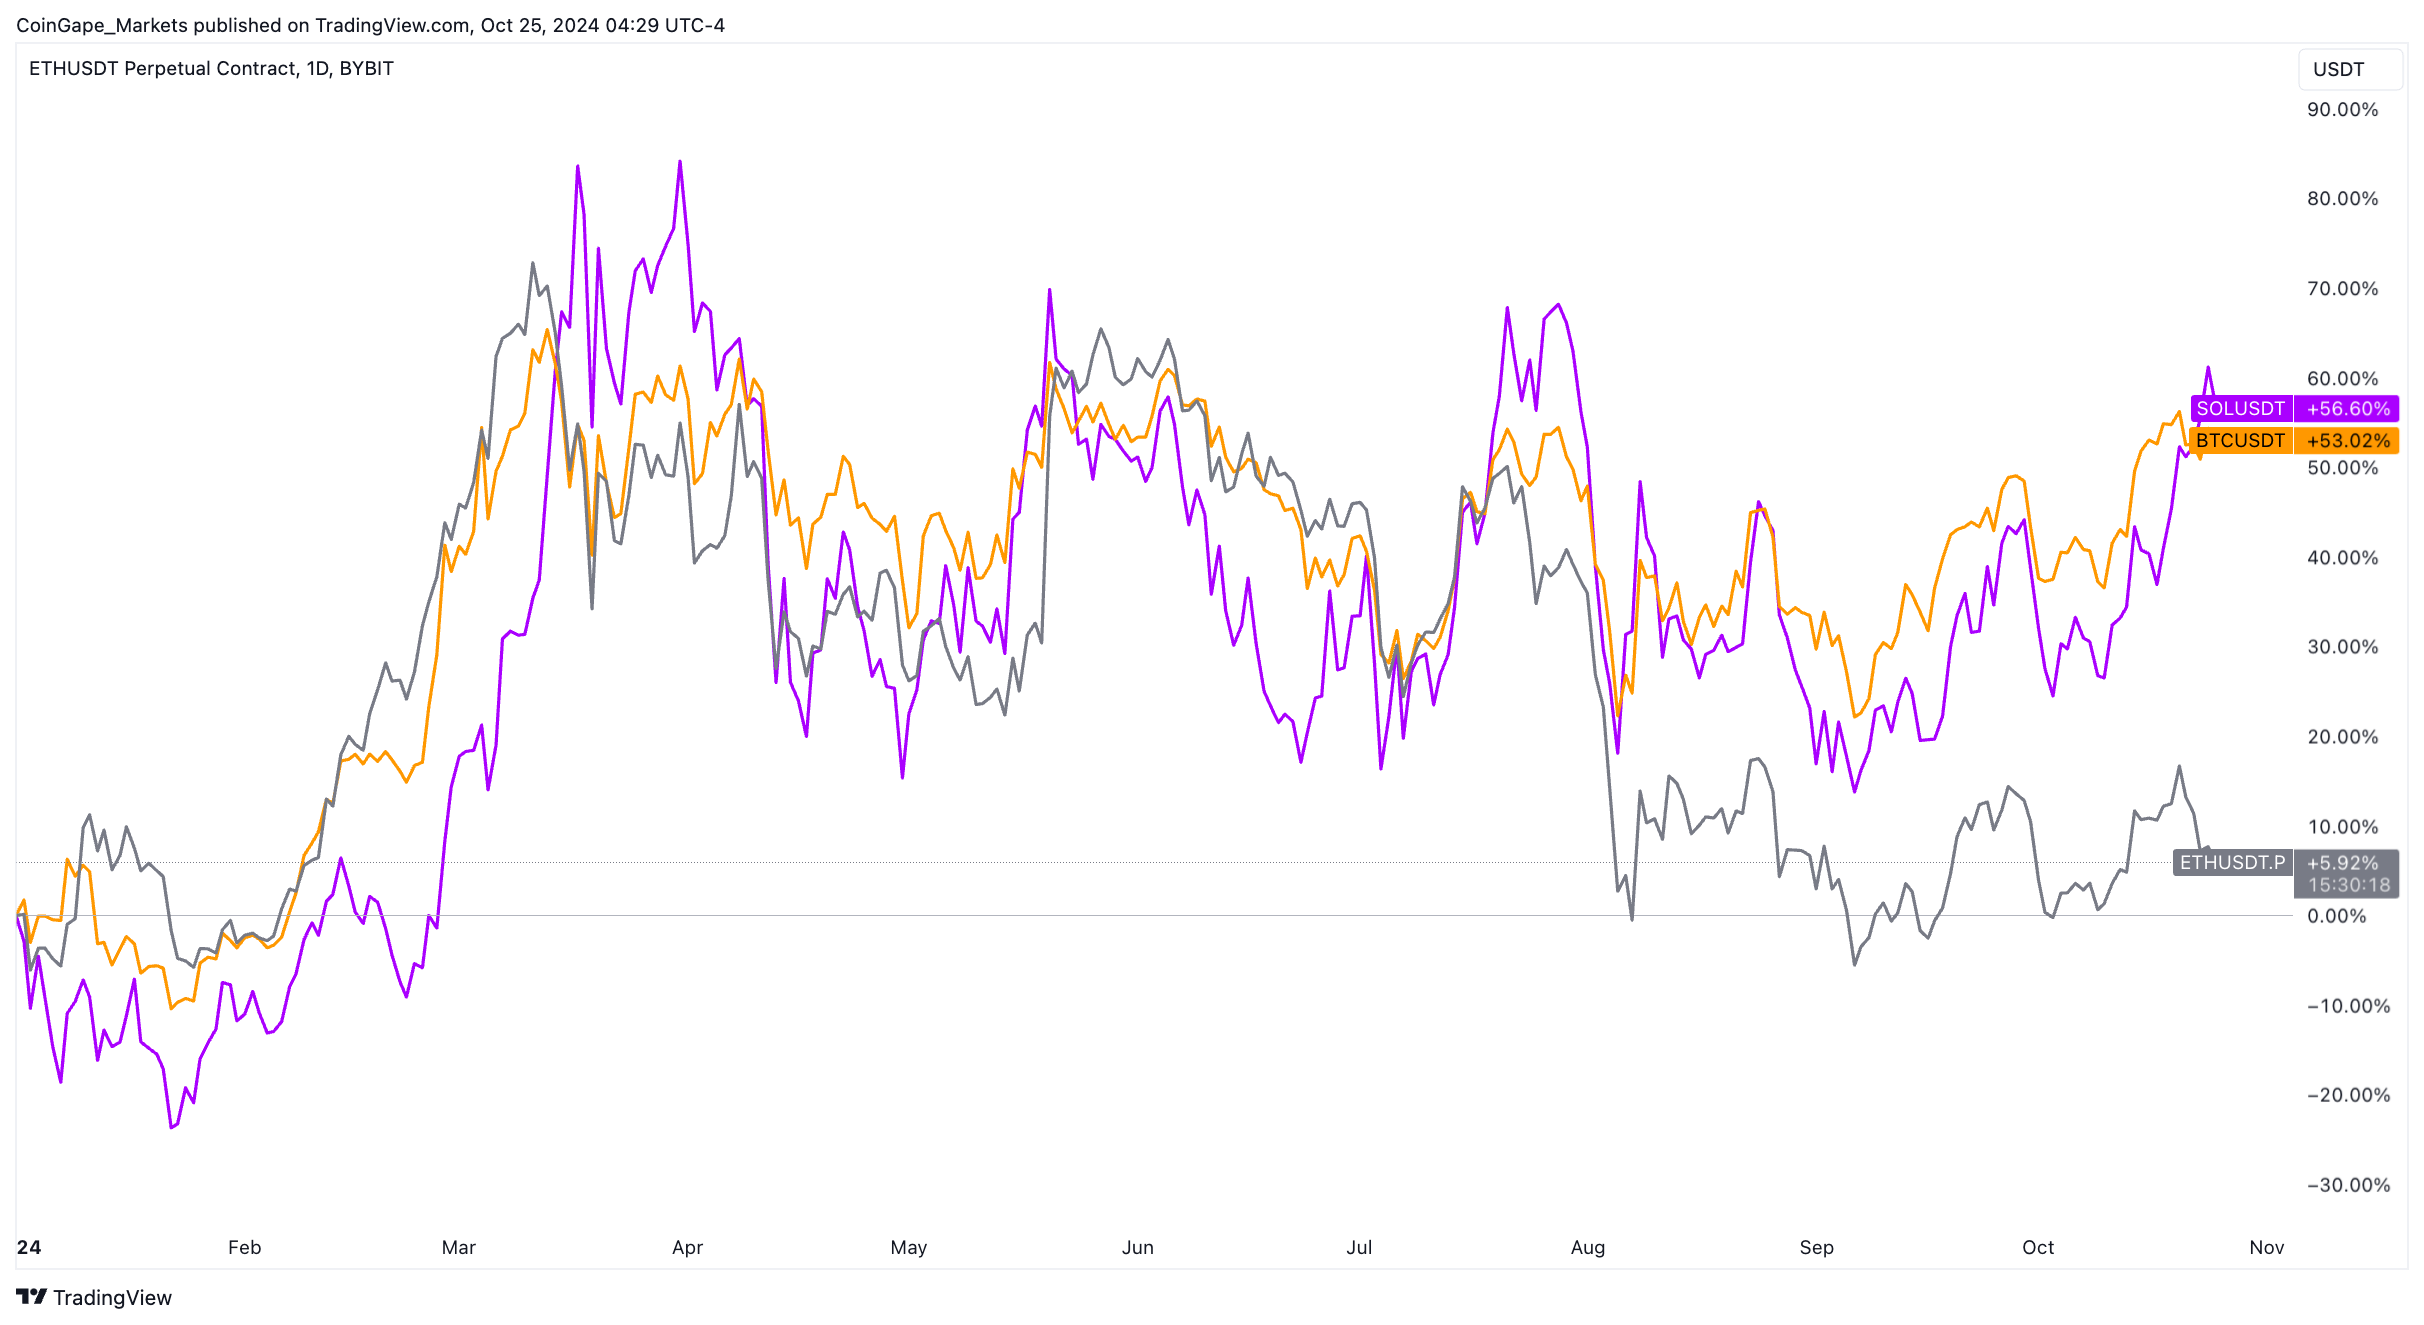
In 2024, Bitcoin price has returned nearly 52% which is just below Solana’s 56%. ETH, on the other hand, hovers around 6%. With the start of a bull run in November, this outlook will likely continue, with SOL maintaining a strong lead against BTC & ETH. Other top altcoins are likely going to parabolic as some already have.
The main reason for Bitcoin price surging 52% in the past year is due to the approval of a spot BTC ETF. The rally, to be precise, began after trillion-dollar asset manager BlackRock filed a spot ETF application on June 14, 2023.
The bull run that begain since then has failed to disappoint investors. With the expection of a short-term pressure form Grayscale outflows, the net flow for BTC stands in the billions. This suggests that institutional investors have been accumulating BTC via the ETF instrument.
As of October 25, the cumulative net flow stands around $21.53 billion with $188 million inflow seen on Thursday.

CoinGape prepared a review methodology to rate crypto exchanges, tools, and apps. We curated a list of metrics to evaluate crypto platforms based on their services, user experience, security and customer support, payment gateways and charges, pricing and promotions. Visit our Review Methodology page to learn more about how we review each crypto platform.
This content is purely for educational purposes and should not be considered as financial advice. Do your own research before investing in any crypto platform and only invest the amount you can afford to lose.


 50k+ Articles

