Bitcoin, Ethereum Price Analysis Today: September 19th, 2022
The crypto market continues to bleed, pulling even the majority of cryptocurrencies to their 2022 low. As a result, the Bitcoin price has plunged to the July bottom support of $18600. Moreover, the Ethereum price plummeted to $1250 support, gradually nearing the $1000 psychological support.
Key points price analysis:
- The Bitcoin chart shows a double bottom pattern at $18800 support
- Amid ongoing correction, the Ethereum holder lost the monthly support of $1400
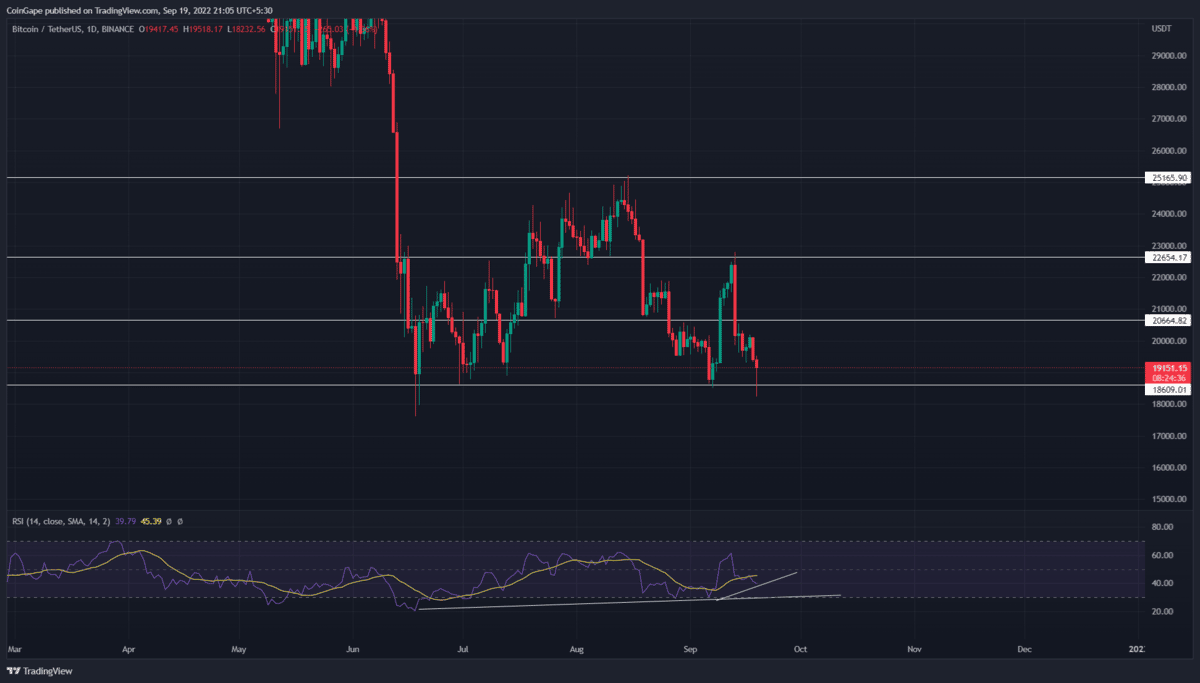
Bitcoin Holds Recovery Opportunity With A Bullish Reversal Pattern
The release of High CPI data triggered the ongoing correction in the Bitcoin price. As a result, the coin price reverted from $22500 and tumbled 17% since last week. Earlier today, the coin trader continued to face selling, and with a 5.7% intraday loss, the price retested the July bottom support of $18600.
However, the selling pressure has nearly evaporated by the press time, and the chart shows a long-wick Doji candle. Thus, a bullish signal candle at crucial support hints at a better possibility of price reversal. Furthermore, the potential breakout from the immediate resistance of $20800 will give additional confirmation for bullish recovery.
If this theory worked out, the Bitcoin price would form a double bottom pattern in the daily time frame chart. The neckline for this pattern is at $25000. For more information on trading this bullish pattern, read this article.
Relative strength index: the daily-RSI chart shows an evident bullish divergence to nearly every retest to the $18600 support in the past three months. Thus, divergence indicates growth in underlying bullish and an additional confirmation of bullish reversal.
Ethereum Price May Retest $1400 Resistance Before The Next Bear Cycle
For the same aforementioned reason, the Ethereum price lost 27.5% since last week and plunged to local support of $1280. However, during this downfall, the coin price breached the monthly support zone of $1400.
This breakdown should accelerate the bearish momentum and extend the ongoing correction to a deeper level
However, the daily chart shows a hammer candle at $1280, with a sufficient boost in volume. This reversal candle suggests the altcoin may rise higher and retest the $1400 mark as potential resistance.
If the selling pressure persists during this retest, the sellers may pull the prices below the $1280 support and plunge the price to $1000 support.
EMAs: the downsloping crucial EMAs(20, 50, 100, and 200) accentuate a downtrend in Ethereum price.
Recent Posts
- Price Analysis
Pi Coin Price Prediction as Expert Warns Bitcoin May Hit $70k After BoJ Rate Hike
Pi Coin price rose by 1.05% today, Dec. 18, mirroring the performance of Bitcoin and…
- Price Analysis
Cardano Price Outlook: Will the NIGHT Token Demand Surge Trigger a Rebound?
Cardano price has entered a decisive phase as NIGHT token liquidity rotation intersects with structural…
- Price Analysis
Will Bitcoin Price Crash to $74K as Japan Eyes Rate Hike on December 19?
Bitcoin price continues to weaken after breaking below its recent consolidation range, now trading within…
- Price Analysis
Bitwise Predicts Solana Price Will Hit New All-Time Highs in 2026
Solana price declined by 4% over the past 24 hours, breaking below the key $130…
- Price Analysis
Bitcoin Price Outlook: Capriole Founder Warns of a Drop Below $50K by 2028
Bitcoin price narratives continue to evolve as long-term downside risks regain attention. Bitcoin price discussions…
- Price Analysis
XRP Price Rare Pattern Points to a Surge to $3 as ETFs Cross $1B Milestone
XRP price dropped by 1.2% today, Dec. 17, continuing a downward trend that started in…