Bitcoin, Ethereum Price Prediction- Market Leaders Form These Bearish Pattern


Bitcoin, Ethereum price prediction: the BTC and ETH prices continue to walk a sideways path creating uncertainty in the crypto market. However, the ongoing consolidation in these coins indicates a short break before the market resumes its downtrend. The global crypto market stood at $836.78 billion at 7:58 am EST Friday, down 1.22 % from yesterday.
Nevertheless, the total crypto market volume has decreased by 10.5% over the last 24 hours to $50.06 Billion. Currently, the total volume in DeFi is $2.54 Billion, which adds up to 5.08% of the total crypto market 24-hour volume.
Top Gainers and Losers
 Source- Coin360
The highest gainer among the top 100 cryptocurrencies in the last 24 hours is Chiliz (CHZ), which rose 9.96% to hit $0.249, while the Stacks (STX) surged 9.35% to reach $0.25. On the other hand, the top losers are GateToken and Synthetix, where the GT price dropped 2.62% to reach $3.6; meanwhile, the SNX price tumbled 2.21% and currently trades at $1.73.
Bitcoin Price
 Source- Coinmarketcap
The Bitcoin price went sideways after the last week’s blood bath in the crypto market. However, this consolidation reflects the formation of an inverted pennant pattern. The core concept for this pattern is to offer a break period(consolidation) before the sellers resume the prevailing downtrend.
The Bitcoin price currently trades at the $16766.2 mark and continues to resonate with two converging trendlines.
 Source- Tradingview
As per the technical setup, a breakdown below the lower support trendline will signal the replenished selling momentum, which could drop the prices by $15825.
On a contrary note, a breakout above the overhead trendline will invalidate the bearish theory.
Ethereum price
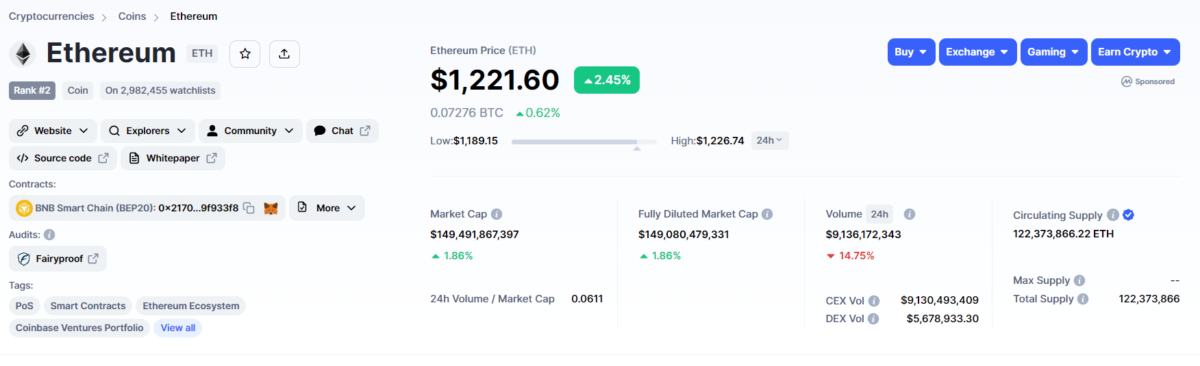 Source- Coinmarketcap
The Ethereum price shows the formation of a descending triangle pattern in the four-time frame chart. The lower higher formation shown in the chart indicates the losing bullish momentum, which may eventually lead to support neckline breakdown.
The Ethereum price currently trades at $1219, and the neckline support for this pattern stands at the $1190-$1180 mark. Thus, a 4-hour candle closing below mentioned support would accelerate the selling momentum.
 Source-Tradingview
The post-breakdown fall would tumble the precis 8% down to rechallenge the $1000 support.
Conversely, a breakout from the pattern’s resistance trendline will offset the bearish thesis.

Why Trust CoinGape
CoinGape has covered the cryptocurrency industry since 2017, aiming to provide informative insights Read more…to our readers. Our journal analysts bring years of experience in market analysis and blockchain technology to ensure factual accuracy and balanced reporting. By following our Editorial Policy, our writers verify every source, fact-check each story, rely on reputable sources, and attribute quotes and media correctly. We also follow a rigorous Review Methodology when evaluating exchanges and tools. From emerging blockchain projects and coin launches to industry events and technical developments, we cover all facets of the digital asset space with unwavering commitment to timely, relevant information.
Related Articles


- Crypto Market Bill Nears Resolution as Ripple CLO Signals Compromise After Key Meeting
- $3.5T Banking Giant Goldman Sachs Discloses $2.3B Bitcoin, Ethereum, XRP, and Solana Exposure
- Why is XRP Price Dropping Today?
- Breaking: FTX’s Sam Bankman-Fried (SBF) Seeks New Trial Amid Push For Trump’s Pardon
- Fed’s Hammack Says Rate Cuts May Stay on Hold Ahead of Jobs, CPI Data Release
- Bitcoin Price Analysis Ahead of US NFP Data, Inflation Report, White House Crypto Summit
- Ethereum Price Outlook As Vitalik Dumps ETH While Wall Street Accumulates
- XRP Price Prediction Ahead of White House Meeting That Could Fuel Clarity Act Hopes
- Cardano Price Prediction as Bitcoin Stuggles Around $70k
- Bitcoin Price at Risk of Falling to $60k as Goldman Sachs Issues Major Warning on US Stocks
- Pi Network Price Outlook Ahead of This Week’s 82M Token Unlock: What’s Next for Pi?


