

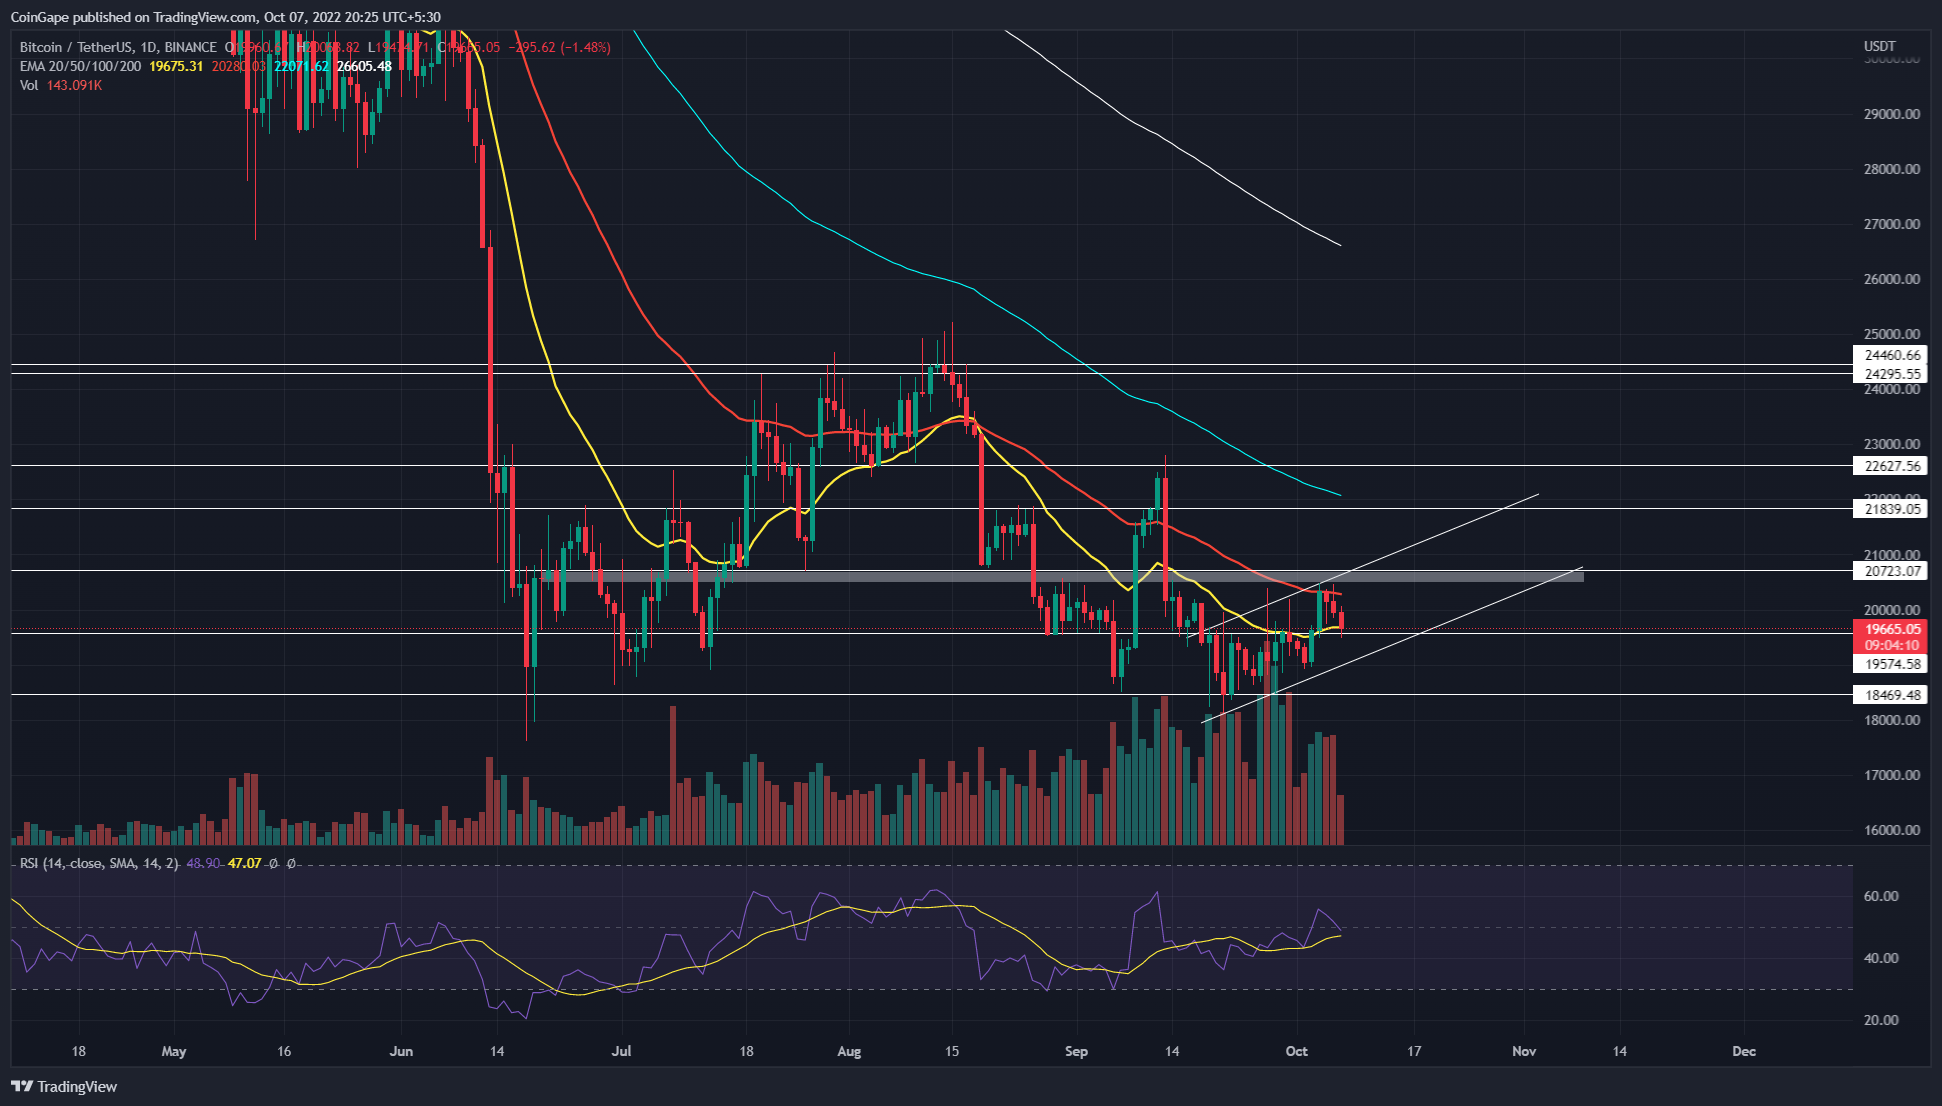
Bitcoin Market Value Responds To This Bullish Pattern; Is $22000 Within Reach?


A recent reversal from the combined resistance of $20500 and resistance trendline have plunged the prices 4.2% down to retest the $19600 flipped support. This horizontal level and the rising support trendline should form a high reversal point from $19500-19200. However, losing this support may plummet the Bitcoin market value to $19500.
Key points:
- The rising parallel channel pattern is leading to a short-term recovery in Bitcoin
- A breakdown from the support trendline will undermine the recovery gains
- The intraday trading volume in Bitcoin is $30 Billion, indicating an 18% loss
 Source-Tradingview
The crypto market has witnessed quite an uncertainty in the past two weeks. As a result, the major cryptocurrencies walked a sideways path, and Bitcoin prices remained trapped with $19600 and $18350 barriers.
However, on October 3rd, the Bitcoin value experienced a significant inflow and bolstered a bullish breakout from the $19600 resistance. The follow-up candle pushed the prices higher to hit the $20500-$20730 resistance zone.
Furthermore, the traders faced strong supply at this resistance resulting in a sharp price reversal. The three consecutive red candles with a substantial surge in volume activity indicate the sellers have not thrown the towel yet.
Moreover, the recent price action reveals the Bitcoin market value is rising within a rising channel pattern. The technical setup for this pattern allows traders to replenish the selling pressure and resume the prior downtrend. Thus, the bearish breakdown from the support trendline will trigger the bearish pattern and may plunge the coin price back to the $18500 support zone.
However, until the price action remains within the pattern, Bitcoin could obtain more gains. Furthermore, in optimum conditions, a bullish breakout of this resistance trendline will breach the overhead trendline and offset the bearish thesis.
Technical Indicator
Relative Strength Index: A bullish divergence in the daily-RSI slope shows a strong buying activity around the $18500 mark. If the indicator value sustains above the midline, the positive attitude gained should push the recovery rally higher.
EMAs: the breached 20-day EMA offers additional support to buyers at $19600. However, the retest of crucial EMAs(50, 100, and 200) is assisting sellers in maintaining a bearish outlook.
Bitcoin Price Intraday Levels
- Spot rate: $19600
- Trend: Downtrend
- Volatility: Medium
- Resistance level- $20600 and $21800
- Support level- $19600 and $18500-18300

Why Trust CoinGape
CoinGape has covered the cryptocurrency industry since 2017, aiming to provide informative insights Read more…to our readers. Our journal analysts bring years of experience in market analysis and blockchain technology to ensure factual accuracy and balanced reporting. By following our Editorial Policy, our writers verify every source, fact-check each story, rely on reputable sources, and attribute quotes and media correctly. We also follow a rigorous Review Methodology when evaluating exchanges and tools. From emerging blockchain projects and coin launches to industry events and technical developments, we cover all facets of the digital asset space with unwavering commitment to timely, relevant information.
Premium Partners


Related Articles


- Michael Saylor’s Strategy Faces 2025 Q4 Loss Following Bitcoin and MSTR’s Crash
- Bitcoin Rises to $90K Even as Trump Defends Tariffs Ahead of Supreme Court Ruling
- Bitget’s 2025 Recap: Bitcoin and Gold Lead as ‘Safe Haven’ Assets as Dollar Posts Worst Yearly Loss
- BlackRock Moves Bitcoin and Ethereum, Stirring Sell-Off Fears Ahead of $2.2B Options Expiry
- Why is PEPE Coin Rising Today (Jan 2)
- Ethereum Price Prediction 2026 As Vitalik Buterin Unveils New Scaling Roadmap
- Bitcoin Price and XRP Price Prediction 2026 Ahead of US Crypto Reserve, CLARITY Act
- Analyst Predicts Cardano Price to Surge 103% to $0.75 as Midnight, Leios Launch Near
- Dogecoin Price Jumps 10% as Whales Scoop Up 220M DOGE; What’s Next?
- Here’s Why Crypto Market Turns Bullish as 2026 Kicks Off
- Pepe Coin price Enters 2026 with a 25% Surge as Open Interest Jumps 82% — What’s Next?


