Bitcoin (BTC) On-Chain Data Suggests A Dip To $40k Support; Key Factors To Keep An Eye


For the last few weeks, the BTC/USD pair has been quite volatile. The recent recovery rallied to the $45000 mark and registered a 38% gain from the $33177 low. However, the Bitcoin (BTC) price turned down from the overhead resistance, indicating the bears are aggressive at this level. The coin price could sink to $40000 support to test the buyers’ commitment.
Bitcoin (BTC) On-chain Data Struggles To Maintain A Bullish Outlook
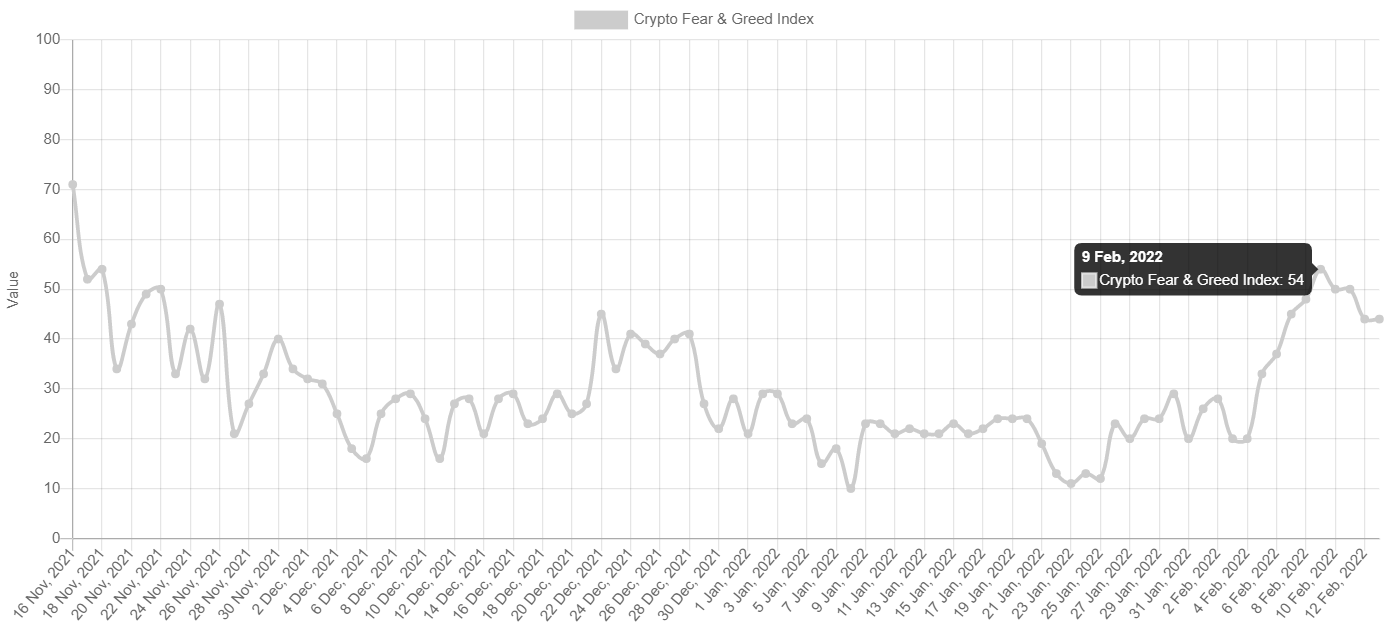
- On February 9th, the Crypto Fear & Greed Index reached the neutral level of 54, which last recorded this high on November 2021. However, due to the recent pullback, the metric has fallen back to fear(44) territory.
- Similar to the above scenario, which was recently highlighted by @SwellCycle, the 7-day Moving average STH-SOPR indicator(which represents the degree of realized profit and loss for all coins moved on-chain for Short-term holders. i.e., with a holding lifespan of fewer than 155 days.) surged above the 1 mark.
- However, the slope couldn’t sustain much longer and slid below 1 support, indicating a clear bullish sentiment has yet been achieved.
Bitcoin (BTC) Price Technical Analysis
 Source-Tradingview
On February 4th, the BTC price made a decisive breakout from a confluence of technical levels, i.e., $40000 psychological level, descending trendline, and 20-day EMA. The sustained buying surged the coin price by 13%, bringing it to $45000.
However, the bears continued to defend this resistance, resulting in a minor pullback in price action. The BTC price currently trades at $42564, indicating a 7.2% loss from the overhead resistance. The falling coin price approaches the shared support of $40000 and 20 EMA.
A rebound from this crucial support level would indicate bulls are buying this dip and would give another attempt to push the BTC/USDT pair above $45,000. On a contrary note, if sellers pulled the price below the $40000 mark, the coin price would plunge to $36,721 or $33177.
- Resistance level- $45000, $52000
- Support level- $40000, $36721
Bitcoin price indicators
A recent price jump has turned the dynamic resistance of the 20-day EMA into potential support. Buyers will likely encounter the trend defining 200 EMA near the $45000 mark, which stands as a key barrier to bolster BTC recovery.
Moreover, the RSI(55) slope holding above the 14-SMA and the neutral line suggests the buyers have an upper hand.

Why Trust CoinGape
CoinGape has covered the cryptocurrency industry since 2017, aiming to provide informative insights Read more…to our readers. Our journal analysts bring years of experience in market analysis and blockchain technology to ensure factual accuracy and balanced reporting. By following our Editorial Policy, our writers verify every source, fact-check each story, rely on reputable sources, and attribute quotes and media correctly. We also follow a rigorous Review Methodology when evaluating exchanges and tools. From emerging blockchain projects and coin launches to industry events and technical developments, we cover all facets of the digital asset space with unwavering commitment to timely, relevant information.

Related Articles


- CLARITY Act: White House to Hold Another Meeting as Crypto and Banks Stall on Stablecoin Yield Deal
- Bitcoin as ‘Neutral Global Collateral’? Expert Reveals How BTC Price Could Reach $50M
- XRP Ledger Validator Spotlights Upcoming Privacy Upgrade as Binance’s CZ Pushes for Crypto Privacy
- Harvard Management Co (HMC) Cuts BlackRock Bitcoin ETF Exposure by 21%, Rotates to Ethereum
- Morgan Stanley, Other TradFi Load Up SOL as Solana RWA Tokenized Value Hits $1.66B ATH
- Ethereum Price Outlook as Harvard Shifts Focus from Bitcoin to ETH ETF
- HOOD and COIN Stock Price Forecast as Expert Predicts Bitcoin Price Crash to $10k
- XRP Price Prediction Ahead of Supreme Court Trump Tariff Ruling
- Crypto Price Prediction For This Week: Dogecoin, Solana and Cardano
- Bitcoin Price Prediction: How Could Brazil’s Strategic Bitcoin Reserve Proposal Impact BTC?
- 3 Top Reasons Pi Network Price Surging Today (14 Feb)


