Bitcoin Price Analysis: BTC Holds Near $23,000; What’s Next in Offer?


Bitcoin price analysis (BTC) suggests a slow down in the upside momentum. As the BTC buyers manage to hold above the $23,000 mark, it indicates the underlying bullish sentiment in the coin. As of press time, BTC/USD is trading at $23,168, down 0.65% for the day, while the 24-hour trading volume drops nearly 9% to $24,224,348,018. The recent action in price and volume reflects a lackluster movement for the day.
Bitcoin’s current market setup shows that the price would continue with its upside momentum.
- Bitcoin price remains sidelined as the weekend begins
- A daily candlestick above 23,500 would infuse more buying interest in BTC/USD.
- Failing to sustain 20-day EMA at $22,711 would invalidate the bullish argument.
BTC price sustains upside momentum
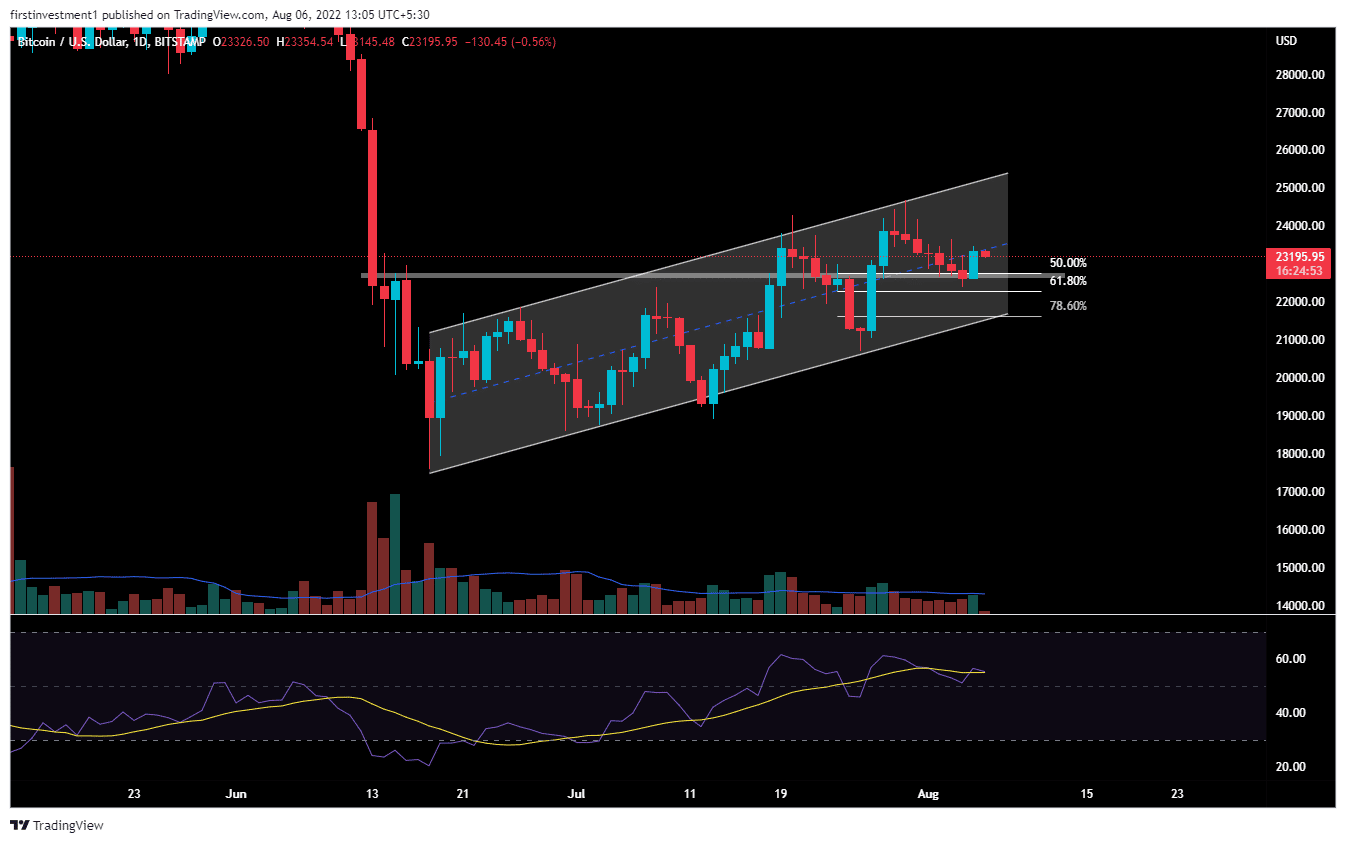
BTC is currently trading in a rising channel, making higher highs and higher lows on a daily basis. Recently, from July 29 to Aug 04, the price retraced after giving an impulse move earlier. The retracement means short-term reversal, lasting no longer than one to two weeks. This corrective pullback takes a pause at 50% Fibonacci retracement, which is an excellent tool for calculating the scope of a retracement. In the previous session, we’ve seen a good upside move from 50% fib. Levels, indicating the continuation of an earlier trend are still intact, which is a sign of bullishness.
The price gave closing above last four days, indicating positiveness near lower levels showing buying interest at the corrective level.
More buyers’ participation would push the price toward the psychological $24,000 level. Further, a takeout of the short-term resistance zone at $24,200 will open the gates for the $26,000 level.
On the flip side, a failure to sustain the $23,000 level would meet the support of $22,600.
The RSI is trading above 50, indicating that the average gain is larger than the average loss. This can be concluded that it’s in an uptrend and offers buying opportunities.
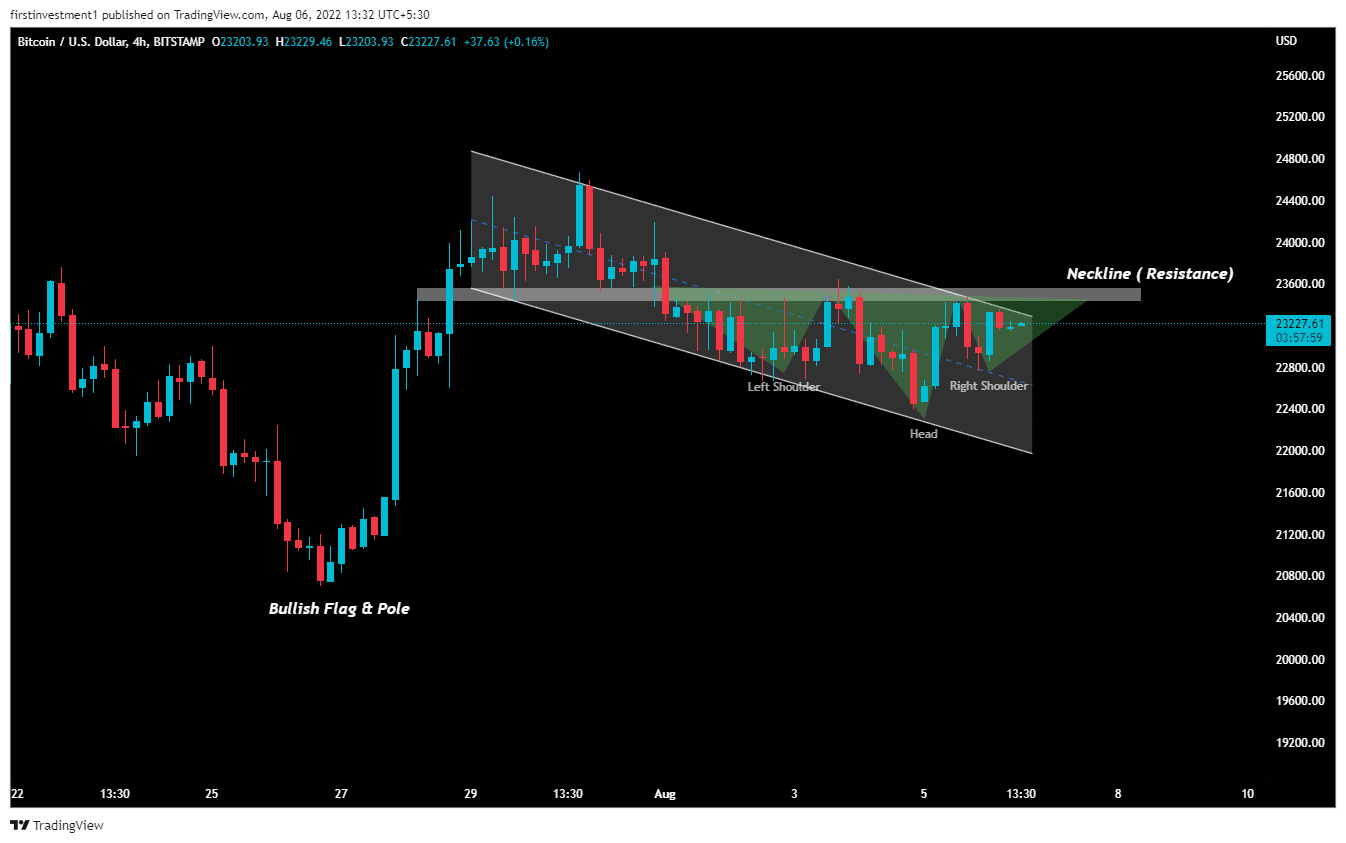
BTC price on the hourly chart is about to give multiple bullish breakouts at the same level at $23,655. The price has formed a bullish “Flag and Pole Pattern”, along with an inverted “Head & Shoulder Pattern”, showing great strength. According to this pattern, if the price breaks its neckline on the higher level above $23,655 with good volumes, then the expected upside, the BTC price can go above $24,250 to $24,650.
On the other hand, a break below the $22,600 level could invalidate the bullish outlook. And the price can be below $22,200.
BTC is bullish on all time frames. Above $23,650 closing on the hourly time frame, we can put a trade on the Buy side.

Why Trust CoinGape
CoinGape has covered the cryptocurrency industry since 2017, aiming to provide informative insights Read more…to our readers. Our journal analysts bring years of experience in market analysis and blockchain technology to ensure factual accuracy and balanced reporting. By following our Editorial Policy, our writers verify every source, fact-check each story, rely on reputable sources, and attribute quotes and media correctly. We also follow a rigorous Review Methodology when evaluating exchanges and tools. From emerging blockchain projects and coin launches to industry events and technical developments, we cover all facets of the digital asset space with unwavering commitment to timely, relevant information.

Related Articles


- What Will Spark the Next Bitcoin Bull Market? Bitwise CIO Names 4 Factors
- U.S. CPI Release: Wall Street Predicts Soft Inflation Reading as Crypto Market Holds Steady
- Bhutan Government Cuts Bitcoin Holdings as Standard Chartered Predicts BTC Price Crash To $50k
- XRP News: Binance Integrates Ripple’s RLUSD on XRPL After Ethereum Listing
- Breaking: SUI Price Rebounds 7% as Grayscale Amends S-1 for Sui ETF
- Solana Price Prediction as $2.6 Trillion Citi Expands Tokenized Products to SOL
- Bitcoin Price Could Fall to $50,000, Standard Chartered Says — Is a Crash Coming?
- Cardano Price Prediction Ahead of Midnight Mainnet Launch
- Pi Network Price Prediction as Mainnet Upgrade Deadline Nears on Feb 15
- XRP Price Outlook Amid XRP Community Day 2026
- Ethereum Price at Risk of a 30% Crash as Futures Open Interest Dive During the Crypto Winter


