Bitcoin Price Analysis: $BTC Price Edging Closer to Bullish Breakout; Time to Buy?


Bitcoin Price Analysis: Defying the increasing selling pressure in the crypto market, the leading cryptocurrency Bitcoin has moved sideways over the past two weeks. The daily chart showcasing multiple Doji candles (candles with no body and high wick) indicates no initiation from buyers or sellers to take trend control. However, amid this consolidation, this BTC price is respected by two converging trendlines suggesting the formation of a symmetrical triangle pattern.
Also Read: Where May Bitcoin Price Head in June; $30k or $22k?
Bitcoin Price Daily Chart:
- The formation of the triangle pattern suggests that Bitcoin’s price is currently stuck in a no-trading zone.
- A breakout from the wedge pattern is needed to initiate a bullish recovery.
- The intraday trading volume in Bitcoin is $8.93 billion, indicating a 38% loss.
 (Source: Tradingview)
Formation of Symmetrical Triangle Pattern:
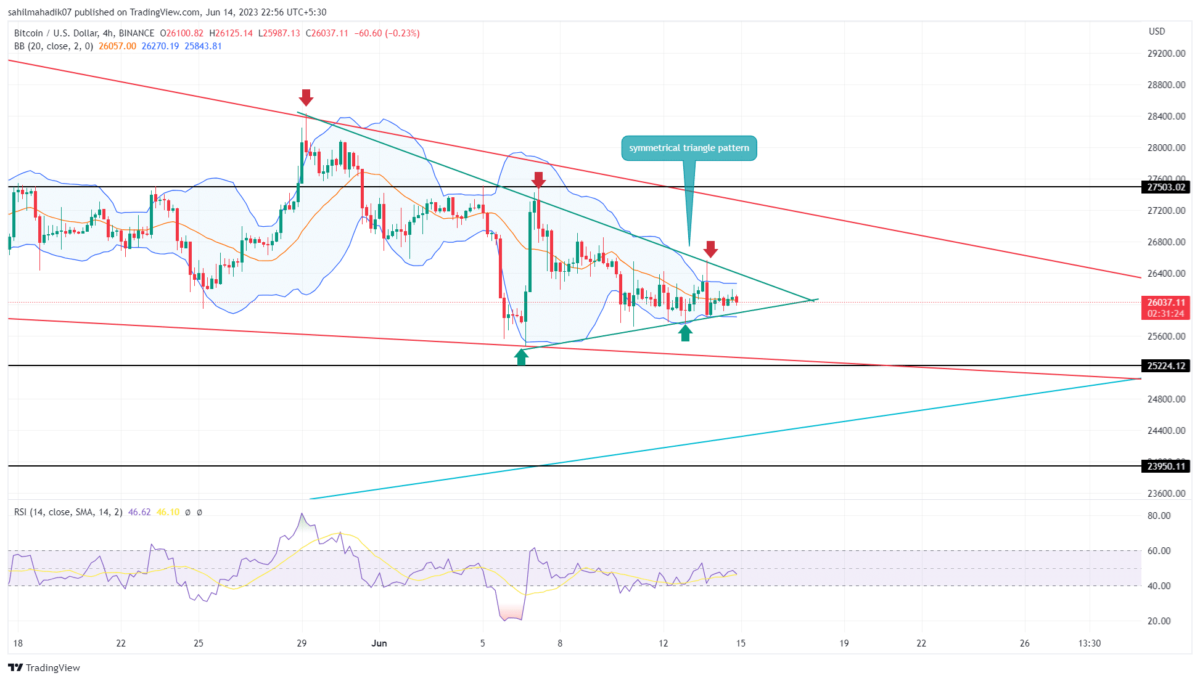
On the 4-hour timeframe chart, Bitcoin’s price shows the formation of a symmetrical triangle pattern. This chart setup is a well-known continuation pattern that carries forward the prior trend momentum upon the breakout of the trendline barrier.
Currently, Bitcoin is trading at $26,095 with a minimal gain of $0.15. While the short-term trend remains bearish, the price is likely to break below the bottom trendline of the pattern, intensifying selling pressure.
A potential breakout below the trendline will increase selling pressure and push the BTC price back to the combined support level of $25,000 or the support trendline of the falling wedge pattern.
A bullish breakout from the triangle pattern will invalidate the bearish thesis.
Will Bitcoin Price Rise to $27,000?
For Bitcoin’s price to reach $27,000 in the coming weeks, it needs to break out from the resistance trendline of the triangle pattern. This breakout will provide buyers with a significant opportunity to push prices 3.6% higher. Additionally, a breakout above the wedge pattern will trigger a significant recovery in Bitcoin’s price.
- Relative Strength Index: Contrary to the sideways action, there has been notable growth in the daily RSI slope, indicating underlying bullish momentum and suggesting a plausible breakout from the triangle pattern.
- Bollinger Bands: The contraction of the Bollinger Bands reflects market uncertainty and the need for a significant breakout to establish a new trend.

Why Trust CoinGape
CoinGape has covered the cryptocurrency industry since 2017, aiming to provide informative insights Read more…to our readers. Our journal analysts bring years of experience in market analysis and blockchain technology to ensure factual accuracy and balanced reporting. By following our Editorial Policy, our writers verify every source, fact-check each story, rely on reputable sources, and attribute quotes and media correctly. We also follow a rigorous Review Methodology when evaluating exchanges and tools. From emerging blockchain projects and coin launches to industry events and technical developments, we cover all facets of the digital asset space with unwavering commitment to timely, relevant information.
Related Articles


- Coinbase Exchange Review 2026 – A Deep Dive into Fees, Features and Security
- Crypto Traders Brace for $8.5B in Bitcoin and Ethereum Options Expiry Today
- Bitcoin Drops to Two-Month Low as Crypto Market Braces for Trump Executive Order
- Binance to Move $1B SAFU Fund Into Bitcoin Reserve Despite BTC Price Dip
- Who is the Next Fed Chair? Trump Set to Name Kevin Warsh as Powell Successor Today
- XRP Price Outlook Ahead of Possible Government Shutdown
- Ethereum and XRP Price Prediction as Odds of Trump Attack on Iran Rise
- Gold and S&P 500 Price Prediction as BTC $88K Sparks Global Risk-On Rally
- How High Can Hyperliquid Price Go in Feb 2026?
- Top Meme Coins Price Prediction: Dogecoin, Shiba Inu, Pepe, and Pump. Fun as Crypto Market Recovers.
- Solana Price Targets $200 as $152B WisdomTree Joins the Ecosystem


