Bitcoin Price Analysis: $BTC Price Edging Closer to Bullish Breakout; Time to Buy?
Bitcoin Price Analysis: Defying the increasing selling pressure in the crypto market, the leading cryptocurrency Bitcoin has moved sideways over the past two weeks. The daily chart showcasing multiple Doji candles (candles with no body and high wick) indicates no initiation from buyers or sellers to take trend control. However, amid this consolidation, this BTC price is respected by two converging trendlines suggesting the formation of a symmetrical triangle pattern.
Also Read: Where May Bitcoin Price Head in June; $30k or $22k?
Bitcoin Price Daily Chart:
- The formation of the triangle pattern suggests that Bitcoin’s price is currently stuck in a no-trading zone.
- A breakout from the wedge pattern is needed to initiate a bullish recovery.
- The intraday trading volume in Bitcoin is $8.93 billion, indicating a 38% loss.
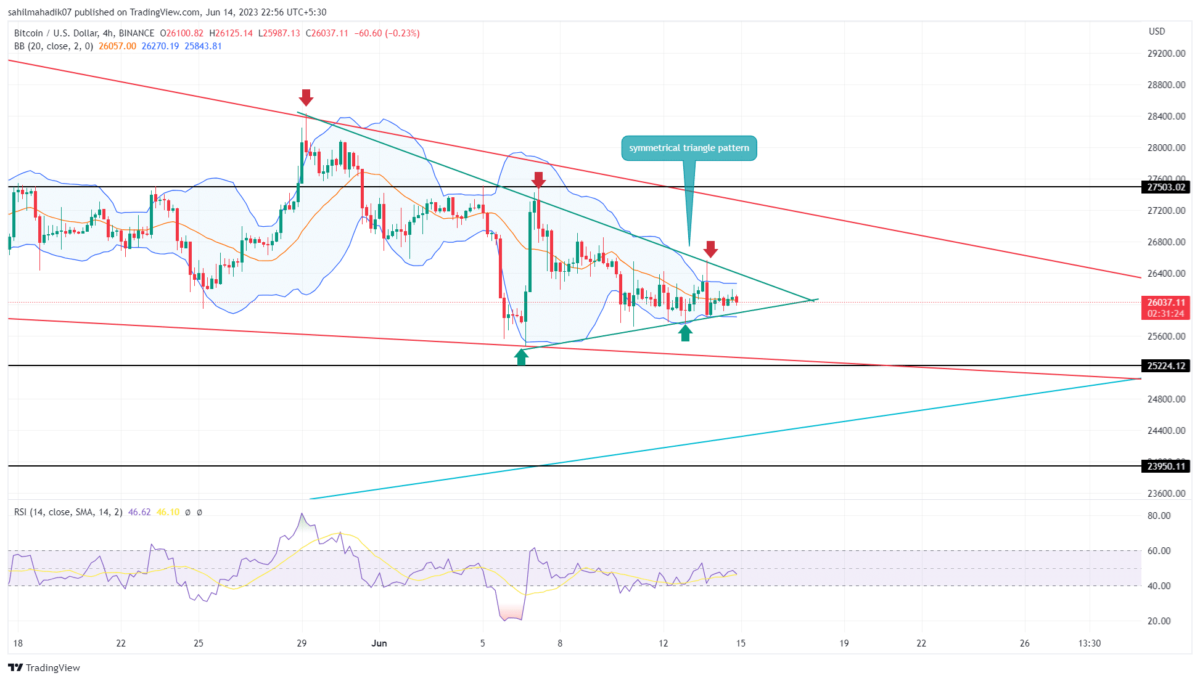
Formation of Symmetrical Triangle Pattern:
On the 4-hour timeframe chart, Bitcoin’s price shows the formation of a symmetrical triangle pattern. This chart setup is a well-known continuation pattern that carries forward the prior trend momentum upon the breakout of the trendline barrier.
Currently, Bitcoin is trading at $26,095 with a minimal gain of $0.15. While the short-term trend remains bearish, the price is likely to break below the bottom trendline of the pattern, intensifying selling pressure.
A potential breakout below the trendline will increase selling pressure and push the BTC price back to the combined support level of $25,000 or the support trendline of the falling wedge pattern.
A bullish breakout from the triangle pattern will invalidate the bearish thesis.
Will Bitcoin Price Rise to $27,000?
For Bitcoin’s price to reach $27,000 in the coming weeks, it needs to break out from the resistance trendline of the triangle pattern. This breakout will provide buyers with a significant opportunity to push prices 3.6% higher. Additionally, a breakout above the wedge pattern will trigger a significant recovery in Bitcoin’s price.
- Relative Strength Index: Contrary to the sideways action, there has been notable growth in the daily RSI slope, indicating underlying bullish momentum and suggesting a plausible breakout from the triangle pattern.
- Bollinger Bands: The contraction of the Bollinger Bands reflects market uncertainty and the need for a significant breakout to establish a new trend.
Recent Posts
- Price Analysis
XRP Price Prediction: Will 4 Billion Transactions Spark Next Rally?
XRP price trades below the $2 mark after the latest correction across the broader cryptocurrency…
- Price Analysis
Solana Price Outlook: Will SOL Recover With Strong Institutional Buying?
Solana price remains steady above the $120 support after the recent crypto market pullback. The…
- Price Analysis
Ethereum Price Risks Crash to $2,500 Amid Sustained Wintermute Dumping
Ethereum price dropped below the key support at $3,000 on Tuesday, down by ~40% from…
- Price Analysis
Is It Time to Sell Bitcoin for Gold- Analyst Spots 2023 Pattern That Triggered BTC’s Last Major Rally
The Stock Market rose modestly as crypto market consolidation sparked a fresh Bitcoin vs Gold…
- Price Analysis
Bitcoin Price Prediction and Analysis: Will BTC Hit $100k Before Year-End?
Bitcoin price moves into the final trading sessions with uncertainty around upside continuation. BTC price…
- Price Analysis
Bitcoin Price Prediction As Michael Saylor Pauses BTC Purchase- Is A Fall to $74k Imminent?
Michael Saylor's Strategy has paused additional BTC purchases while increasing cash reserves, prompting renewed speculation…