Bitcoin Price Analysis: $BTC Price on Recovery Track; Time To Buy?


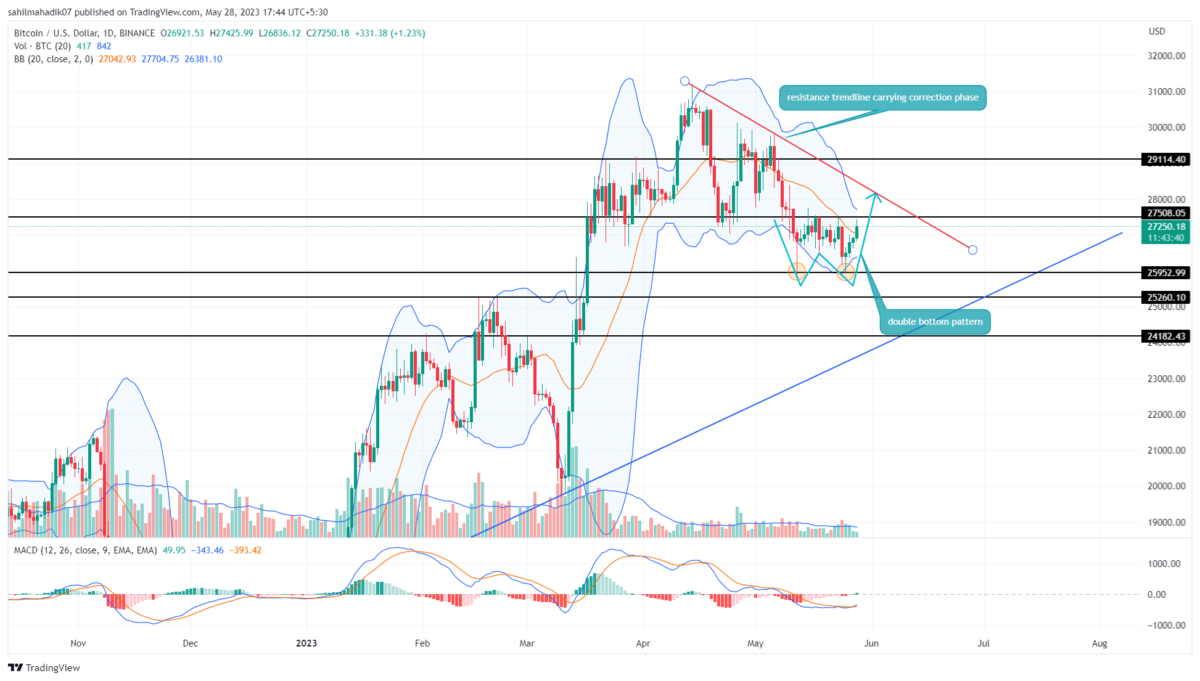
Bitcoin Price Analysis: The Bitcoin price has experienced notable progress in its bullish momentum, evidenced by a series of four consecutive green candles observed on the daily chart. This upswing could be associated with the formation of the double bottom pattern, which results in significant price recovery upon the breakout of its resistance trendline. Thus, the rising BTC price soon challenges the $27500 and validates whether buyers can sustain higher levels or not.
Also Read: Peter Schiff Shocks Crypto Community With Bitcoin NFT Announcement
Bitcoin Price Daily Chart
- Bitcoin price bounced off the $26000 psychological support level in pursuit to end ongoing consolidation on a bullish note.
- The breakout above the $27500 barrier could bolster buyers for a quick 3% jump
- The intraday trading volume in Bitcoin is $5.68 Billion, indicating a 12.5% loss.
 Source-Tradingview
Currently, the Bitcoin price exchanges hands at $27293 with an intraday gain of $1.3%. Under the development of a double bottom pattern, the buyers may push the price higher to break the immediate resistance of $27500.
A successful flip of the aforementioned barrier will provide buyers with a strong foothold to continue the bullish upswing. However, the potential rally may face a major hurdle at the $28000 aligned with the downsloping trendline.
The coin holders should keep a close eye on the price behavior at this trendline as it will significantly influence the future course of this coin.
A decisive daily candlestick closing above the trendline will provide better confirmation of a fresh recovery rally.
Will Bitcoin Price Revisit $28000?
In response to double bottom pattern formation, the Bitcoin price may witness growth in underlying bullish momentum and breach the $27500 barrier. This breakout will keep the buying pressure intact and carry a potential rally to the $28000 barrier in the near future.
- Bollinger Band: A potential breakout from the $27500 barrier will also challenge the upper band of the BB indicator providing a momentum trading opportunity for traders.
- MACD: A bullish crossover between the MACD(blue) and signal(orange) is a sign of trend reversal.

Why Trust CoinGape
CoinGape has covered the cryptocurrency industry since 2017, aiming to provide informative insights Read more…to our readers. Our journal analysts bring years of experience in market analysis and blockchain technology to ensure factual accuracy and balanced reporting. By following our Editorial Policy, our writers verify every source, fact-check each story, rely on reputable sources, and attribute quotes and media correctly. We also follow a rigorous Review Methodology when evaluating exchanges and tools. From emerging blockchain projects and coin launches to industry events and technical developments, we cover all facets of the digital asset space with unwavering commitment to timely, relevant information.
Related Articles


- India’s Crypto Taxation Unchanged as the Existing 30% Tax Retains
- Crypto News: Strategy Bitcoin Underwater After 30% BTC Crash
- Expert Predicts Ethereum Crash Below $2K as Tom Lee’s BitMine ETH Unrealized Loss Hits $6B
- Bitcoin Falls Below $80K as Crypto Market Sees $2.5 Billion In Liquidations
- Top Reasons Why XRP Price Is Dropping Today
- Here’s Why MSTR Stock Price Could Explode in February 2026
- Bitcoin and XRP Price Prediction After U.S. Government Shuts Down
- Ethereum Price Prediction As Vitalik Withdraws ETH Worth $44M- Is a Crash to $2k ahead?
- Bitcoin Price Prediction as Trump Names Kevin Warsh as new Fed Reserve Chair
- XRP Price Outlook Ahead of Possible Government Shutdown
- Ethereum and XRP Price Prediction as Odds of Trump Attack on Iran Rise


