Bitcoin Price Analysis: $BTC Price on Recovery Track; Time To Buy?
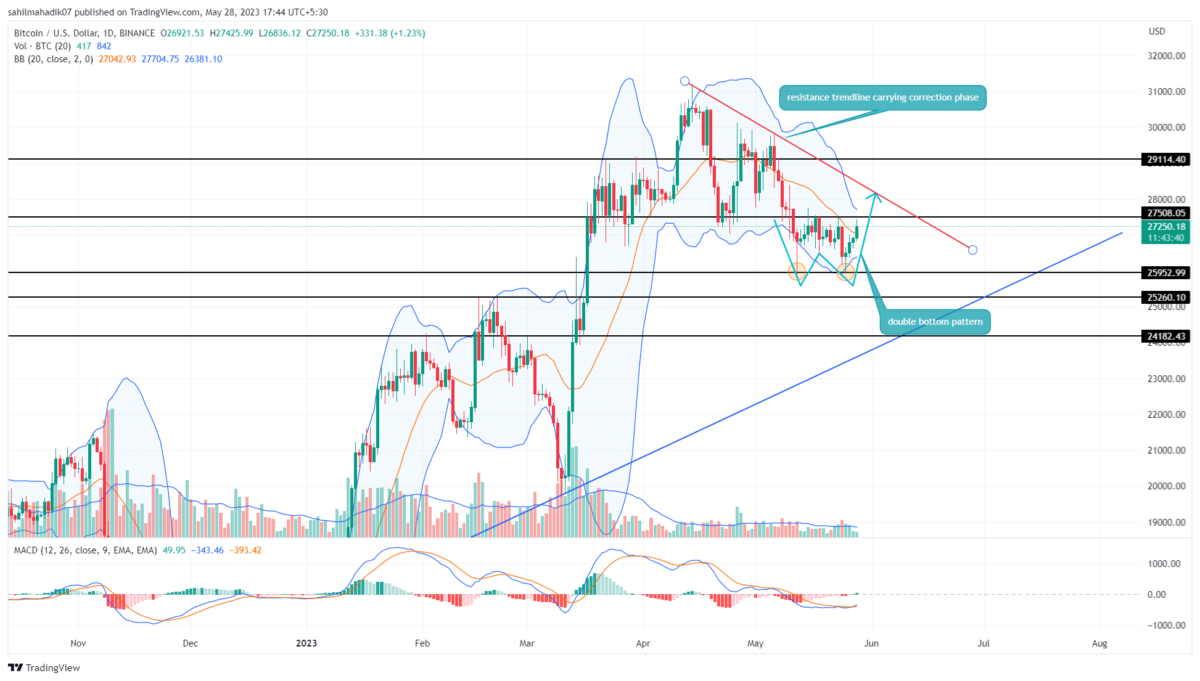
Bitcoin Price Analysis: The Bitcoin price has experienced notable progress in its bullish momentum, evidenced by a series of four consecutive green candles observed on the daily chart. This upswing could be associated with the formation of the double bottom pattern, which results in significant price recovery upon the breakout of its resistance trendline. Thus, the rising BTC price soon challenges the $27500 and validates whether buyers can sustain higher levels or not.
Also Read: Peter Schiff Shocks Crypto Community With Bitcoin NFT Announcement
Bitcoin Price Daily Chart
- Bitcoin price bounced off the $26000 psychological support level in pursuit to end ongoing consolidation on a bullish note.
- The breakout above the $27500 barrier could bolster buyers for a quick 3% jump
- The intraday trading volume in Bitcoin is $5.68 Billion, indicating a 12.5% loss.
Currently, the Bitcoin price exchanges hands at $27293 with an intraday gain of $1.3%. Under the development of a double bottom pattern, the buyers may push the price higher to break the immediate resistance of $27500.
A successful flip of the aforementioned barrier will provide buyers with a strong foothold to continue the bullish upswing. However, the potential rally may face a major hurdle at the $28000 aligned with the downsloping trendline.
The coin holders should keep a close eye on the price behavior at this trendline as it will significantly influence the future course of this coin.
A decisive daily candlestick closing above the trendline will provide better confirmation of a fresh recovery rally.
Will Bitcoin Price Revisit $28000?
In response to double bottom pattern formation, the Bitcoin price may witness growth in underlying bullish momentum and breach the $27500 barrier. This breakout will keep the buying pressure intact and carry a potential rally to the $28000 barrier in the near future.
- Bollinger Band: A potential breakout from the $27500 barrier will also challenge the upper band of the BB indicator providing a momentum trading opportunity for traders.
- MACD: A bullish crossover between the MACD(blue) and signal(orange) is a sign of trend reversal.
Recent Posts
- Price Analysis
Why Bitcoin, Ethereum, XRP, and ADA Prices Are Falling Today
Over the past 24 hours, Bitcoin, Ethereum, XRP, and ADA prices dropped as the broader…
- Price Analysis
Is XRP Price Preparing for Trend Reversal as ETF Inflows Extend to a 7th Straight Week?
The XRP price is in a consolidation stage following months of continuous declining pressure. The…
- Price Analysis
Binance Coin Price Risks Crash to $700 as Key BSC Metric Plunges 80%
Binance Coin price dropped by over 1% today, Dec. 29, as the crypto market remained…
- Price Analysis
SUI Price Forecast: What’s Next for SUI in 2026 After $78.9M Token Unlocks?
SUI price has spent recent sessions consolidating within a narrow range. The action reflect controlled…
- Price Analysis
Solana Price Prediction: How High Could SOL Go in January 2026?
Solana price showed signs of strength in early January 2026, hovering near $127 after a…
- Price Analysis
Top 3 Predictions for Bitcoin price, Ethereum price and XRP price for 2026 According to Analysts
Bitcoin price, Ethereum price, and XRP price show renewed strength heading into 2026 after daily…